Basque vs Immigrants from Uganda Professional Degree
COMPARE
Basque
Immigrants from Uganda
Professional Degree
Professional Degree Comparison
Basques
Immigrants from Uganda
4.6%
PROFESSIONAL DEGREE
81.8/ 100
METRIC RATING
141st/ 347
METRIC RANK
5.0%
PROFESSIONAL DEGREE
98.2/ 100
METRIC RATING
105th/ 347
METRIC RANK
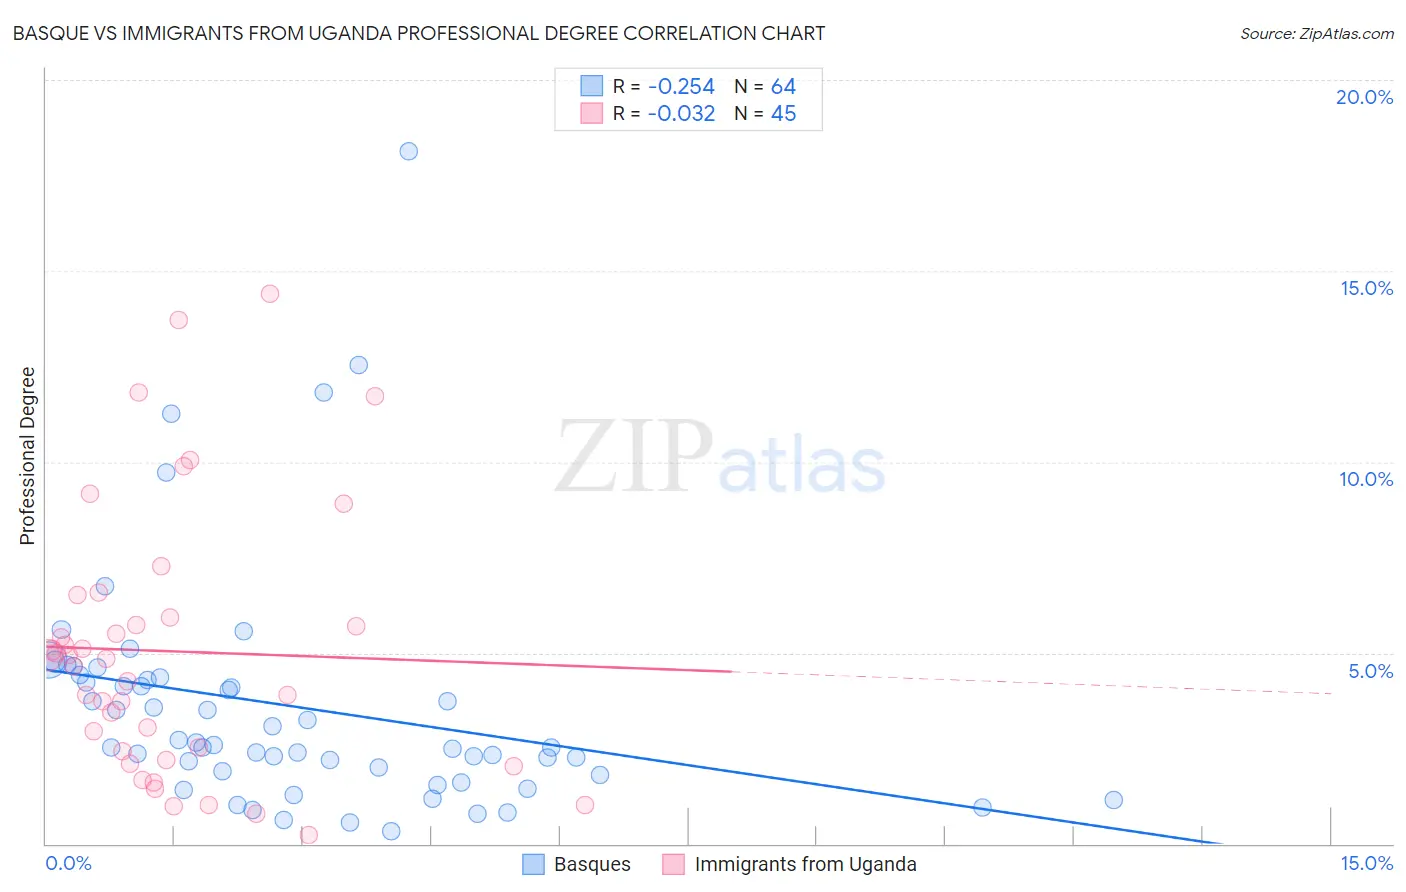
Basque vs Immigrants from Uganda Professional Degree Correlation Chart
The statistical analysis conducted on geographies consisting of 165,605,992 people shows a weak negative correlation between the proportion of Basques and percentage of population with at least professional degree education in the United States with a correlation coefficient (R) of -0.254 and weighted average of 4.6%. Similarly, the statistical analysis conducted on geographies consisting of 125,927,625 people shows no correlation between the proportion of Immigrants from Uganda and percentage of population with at least professional degree education in the United States with a correlation coefficient (R) of -0.032 and weighted average of 5.0%, a difference of 8.5%.
Professional Degree Correlation Summary
| Measurement | Basque | Immigrants from Uganda |
| Minimum | 0.33% | 0.24% |
| Maximum | 18.1% | 14.4% |
| Range | 17.8% | 14.2% |
| Mean | 3.6% | 5.0% |
| Median | 2.6% | 4.9% |
| Interquartile 25% (IQ1) | 1.9% | 2.3% |
| Interquartile 75% (IQ3) | 4.3% | 6.2% |
| Interquartile Range (IQR) | 2.5% | 3.9% |
| Standard Deviation (Sample) | 3.1% | 3.5% |
| Standard Deviation (Population) | 3.1% | 3.4% |
Similar Demographics by Professional Degree
Demographics Similar to Basques by Professional Degree
In terms of professional degree, the demographic groups most similar to Basques are Sudanese (4.6%, a difference of 0.13%), Hungarian (4.6%, a difference of 0.24%), Immigrants from South America (4.6%, a difference of 0.31%), Uruguayan (4.6%, a difference of 0.37%), and Canadian (4.7%, a difference of 0.62%).
| Demographics | Rating | Rank | Professional Degree |
| South American Indians | 89.9 /100 | #134 | Excellent 4.8% |
| Macedonians | 89.8 /100 | #135 | Excellent 4.8% |
| Immigrants | Jordan | 89.0 /100 | #136 | Excellent 4.7% |
| Jordanians | 88.9 /100 | #137 | Excellent 4.7% |
| Afghans | 88.8 /100 | #138 | Excellent 4.7% |
| South Americans | 85.6 /100 | #139 | Excellent 4.7% |
| Canadians | 84.4 /100 | #140 | Excellent 4.7% |
| Basques | 81.8 /100 | #141 | Excellent 4.6% |
| Sudanese | 81.3 /100 | #142 | Excellent 4.6% |
| Hungarians | 80.8 /100 | #143 | Excellent 4.6% |
| Immigrants | South America | 80.5 /100 | #144 | Excellent 4.6% |
| Uruguayans | 80.2 /100 | #145 | Excellent 4.6% |
| Luxembourgers | 78.7 /100 | #146 | Good 4.6% |
| Colombians | 77.7 /100 | #147 | Good 4.6% |
| Slovenes | 76.1 /100 | #148 | Good 4.6% |
Demographics Similar to Immigrants from Uganda by Professional Degree
In terms of professional degree, the demographic groups most similar to Immigrants from Uganda are Arab (5.0%, a difference of 0.020%), Immigrants from Ukraine (5.0%, a difference of 0.030%), Maltese (5.0%, a difference of 0.15%), Immigrants from Southern Europe (5.0%, a difference of 0.19%), and British (5.0%, a difference of 0.21%).
| Demographics | Rating | Rank | Professional Degree |
| Austrians | 99.1 /100 | #98 | Exceptional 5.2% |
| Immigrants | Italy | 99.1 /100 | #99 | Exceptional 5.2% |
| Ugandans | 98.8 /100 | #100 | Exceptional 5.1% |
| Immigrants | Egypt | 98.5 /100 | #101 | Exceptional 5.1% |
| Ukrainians | 98.5 /100 | #102 | Exceptional 5.1% |
| Immigrants | Northern Africa | 98.4 /100 | #103 | Exceptional 5.1% |
| Arabs | 98.2 /100 | #104 | Exceptional 5.0% |
| Immigrants | Uganda | 98.2 /100 | #105 | Exceptional 5.0% |
| Immigrants | Ukraine | 98.2 /100 | #106 | Exceptional 5.0% |
| Maltese | 98.1 /100 | #107 | Exceptional 5.0% |
| Immigrants | Southern Europe | 98.1 /100 | #108 | Exceptional 5.0% |
| British | 98.0 /100 | #109 | Exceptional 5.0% |
| Lebanese | 98.0 /100 | #110 | Exceptional 5.0% |
| Brazilians | 97.4 /100 | #111 | Exceptional 5.0% |
| Taiwanese | 97.3 /100 | #112 | Exceptional 5.0% |