Hopi vs South African Professional Degree
COMPARE
Hopi
South African
Professional Degree
Professional Degree Comparison
Hopi
South Africans
3.6%
PROFESSIONAL DEGREE
0.9/ 100
METRIC RATING
263rd/ 347
METRIC RANK
5.7%
PROFESSIONAL DEGREE
100.0/ 100
METRIC RATING
57th/ 347
METRIC RANK
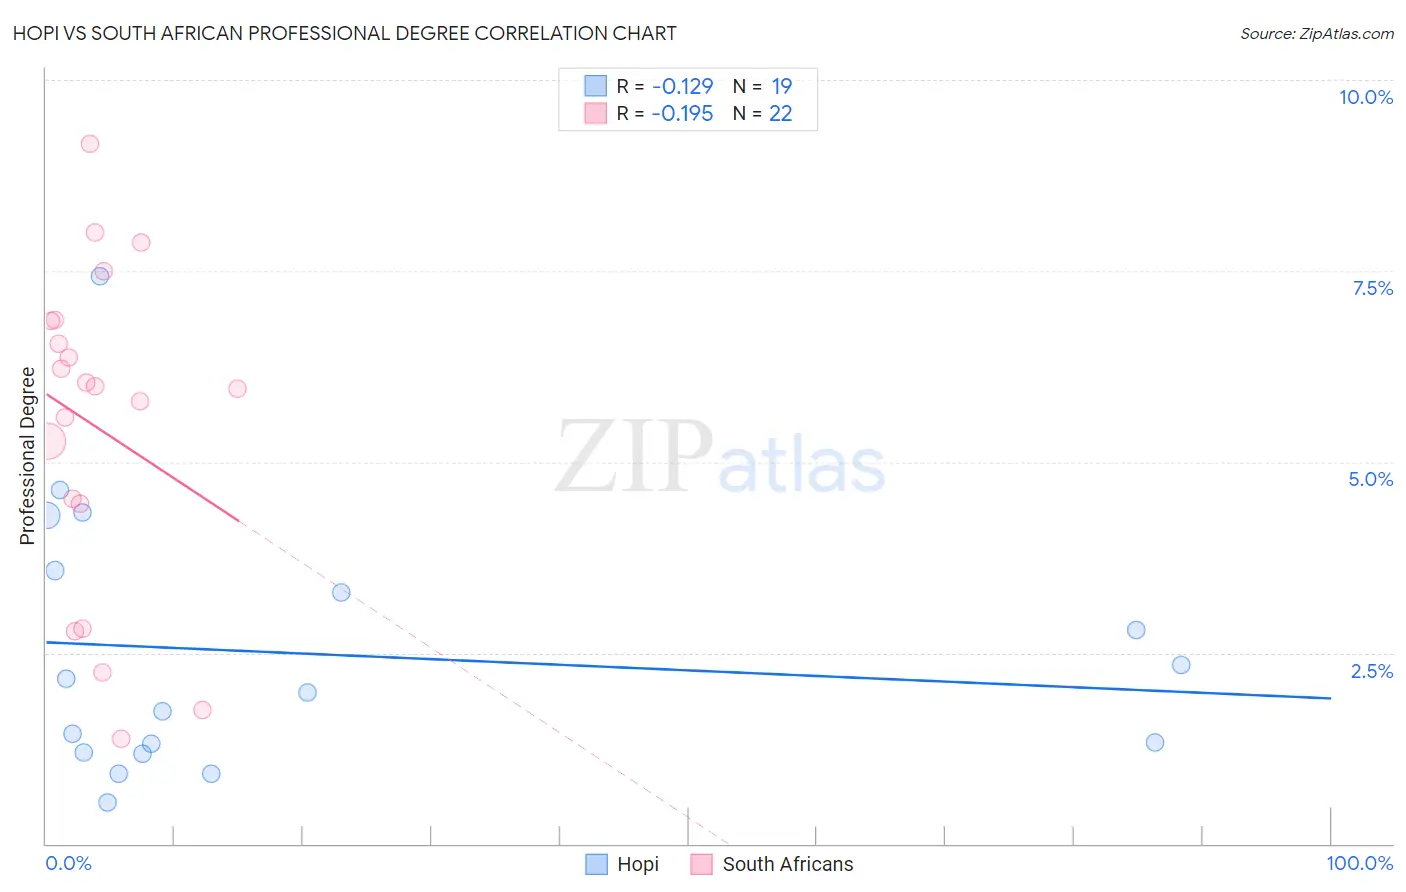
Hopi vs South African Professional Degree Correlation Chart
The statistical analysis conducted on geographies consisting of 74,597,003 people shows a poor negative correlation between the proportion of Hopi and percentage of population with at least professional degree education in the United States with a correlation coefficient (R) of -0.129 and weighted average of 3.6%. Similarly, the statistical analysis conducted on geographies consisting of 182,499,194 people shows a poor negative correlation between the proportion of South Africans and percentage of population with at least professional degree education in the United States with a correlation coefficient (R) of -0.195 and weighted average of 5.7%, a difference of 56.3%.
Professional Degree Correlation Summary
| Measurement | Hopi | South African |
| Minimum | 0.54% | 1.4% |
| Maximum | 7.4% | 9.2% |
| Range | 6.9% | 7.8% |
| Mean | 2.5% | 5.5% |
| Median | 2.0% | 6.0% |
| Interquartile 25% (IQ1) | 1.2% | 4.5% |
| Interquartile 75% (IQ3) | 3.6% | 6.8% |
| Interquartile Range (IQR) | 2.4% | 2.4% |
| Standard Deviation (Sample) | 1.7% | 2.1% |
| Standard Deviation (Population) | 1.7% | 2.1% |
Similar Demographics by Professional Degree
Demographics Similar to Hopi by Professional Degree
In terms of professional degree, the demographic groups most similar to Hopi are Immigrants from Cambodia (3.6%, a difference of 0.020%), Immigrants from Congo (3.6%, a difference of 0.060%), Central American Indian (3.6%, a difference of 0.38%), U.S. Virgin Islander (3.7%, a difference of 0.50%), and Immigrants from Guyana (3.7%, a difference of 0.51%).
| Demographics | Rating | Rank | Professional Degree |
| Iroquois | 1.2 /100 | #256 | Tragic 3.7% |
| Bahamians | 1.1 /100 | #257 | Tragic 3.7% |
| Immigrants | St. Vincent and the Grenadines | 1.1 /100 | #258 | Tragic 3.7% |
| Africans | 1.0 /100 | #259 | Tragic 3.7% |
| Indonesians | 1.0 /100 | #260 | Tragic 3.7% |
| Immigrants | Guyana | 1.0 /100 | #261 | Tragic 3.7% |
| U.S. Virgin Islanders | 1.0 /100 | #262 | Tragic 3.7% |
| Hopi | 0.9 /100 | #263 | Tragic 3.6% |
| Immigrants | Cambodia | 0.9 /100 | #264 | Tragic 3.6% |
| Immigrants | Congo | 0.8 /100 | #265 | Tragic 3.6% |
| Central American Indians | 0.8 /100 | #266 | Tragic 3.6% |
| Delaware | 0.7 /100 | #267 | Tragic 3.6% |
| Aleuts | 0.7 /100 | #268 | Tragic 3.6% |
| Immigrants | Cuba | 0.6 /100 | #269 | Tragic 3.6% |
| Central Americans | 0.6 /100 | #270 | Tragic 3.6% |
Demographics Similar to South Africans by Professional Degree
In terms of professional degree, the demographic groups most similar to South Africans are Immigrants from Malaysia (5.7%, a difference of 0.26%), Immigrants from Western Europe (5.7%, a difference of 0.38%), Bulgarian (5.7%, a difference of 0.59%), Immigrants from Kuwait (5.7%, a difference of 0.79%), and Immigrants from Europe (5.6%, a difference of 1.1%).
| Demographics | Rating | Rank | Professional Degree |
| Immigrants | Czechoslovakia | 100.0 /100 | #50 | Exceptional 5.8% |
| Immigrants | Greece | 100.0 /100 | #51 | Exceptional 5.8% |
| Immigrants | Serbia | 100.0 /100 | #52 | Exceptional 5.8% |
| Immigrants | Netherlands | 100.0 /100 | #53 | Exceptional 5.8% |
| Immigrants | Kuwait | 100.0 /100 | #54 | Exceptional 5.7% |
| Immigrants | Western Europe | 100.0 /100 | #55 | Exceptional 5.7% |
| Immigrants | Malaysia | 100.0 /100 | #56 | Exceptional 5.7% |
| South Africans | 100.0 /100 | #57 | Exceptional 5.7% |
| Bulgarians | 100.0 /100 | #58 | Exceptional 5.7% |
| Immigrants | Europe | 100.0 /100 | #59 | Exceptional 5.6% |
| Bolivians | 99.9 /100 | #60 | Exceptional 5.6% |
| Immigrants | Lithuania | 99.9 /100 | #61 | Exceptional 5.6% |
| Immigrants | Belarus | 99.9 /100 | #62 | Exceptional 5.5% |
| Asians | 99.9 /100 | #63 | Exceptional 5.5% |
| Immigrants | Asia | 99.9 /100 | #64 | Exceptional 5.5% |