Basque vs Immigrants from Philippines Professional Degree
COMPARE
Basque
Immigrants from Philippines
Professional Degree
Professional Degree Comparison
Basques
Immigrants from Philippines
4.6%
PROFESSIONAL DEGREE
81.8/ 100
METRIC RATING
141st/ 347
METRIC RANK
3.9%
PROFESSIONAL DEGREE
4.1/ 100
METRIC RATING
233rd/ 347
METRIC RANK
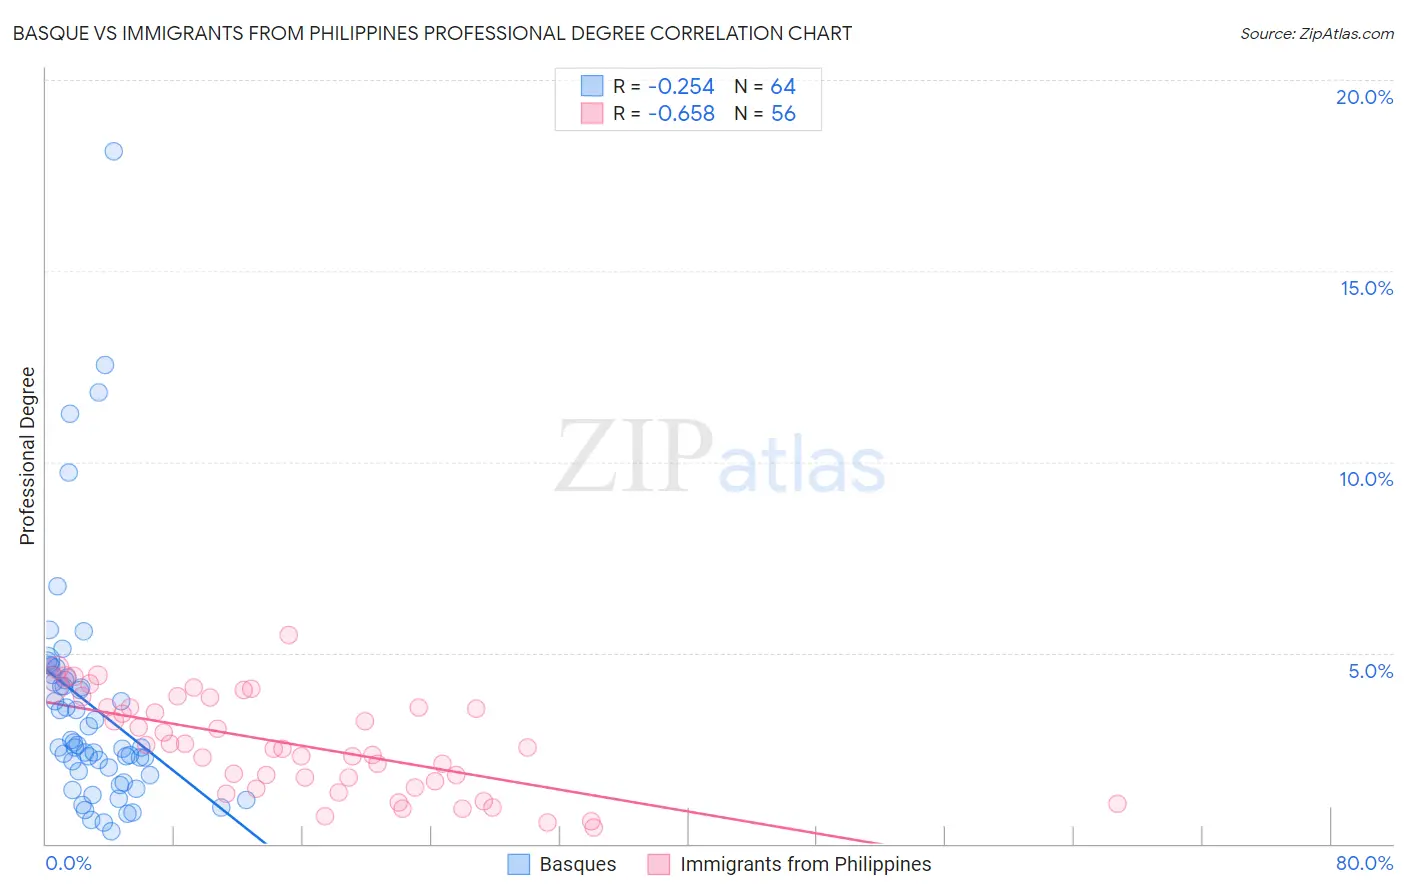
Basque vs Immigrants from Philippines Professional Degree Correlation Chart
The statistical analysis conducted on geographies consisting of 165,605,992 people shows a weak negative correlation between the proportion of Basques and percentage of population with at least professional degree education in the United States with a correlation coefficient (R) of -0.254 and weighted average of 4.6%. Similarly, the statistical analysis conducted on geographies consisting of 469,653,358 people shows a significant negative correlation between the proportion of Immigrants from Philippines and percentage of population with at least professional degree education in the United States with a correlation coefficient (R) of -0.658 and weighted average of 3.9%, a difference of 19.1%.
Professional Degree Correlation Summary
| Measurement | Basque | Immigrants from Philippines |
| Minimum | 0.33% | 0.44% |
| Maximum | 18.1% | 5.5% |
| Range | 17.8% | 5.0% |
| Mean | 3.6% | 2.6% |
| Median | 2.6% | 2.5% |
| Interquartile 25% (IQ1) | 1.9% | 1.6% |
| Interquartile 75% (IQ3) | 4.3% | 3.6% |
| Interquartile Range (IQR) | 2.5% | 2.0% |
| Standard Deviation (Sample) | 3.1% | 1.3% |
| Standard Deviation (Population) | 3.1% | 1.2% |
Similar Demographics by Professional Degree
Demographics Similar to Basques by Professional Degree
In terms of professional degree, the demographic groups most similar to Basques are Sudanese (4.6%, a difference of 0.13%), Hungarian (4.6%, a difference of 0.24%), Immigrants from South America (4.6%, a difference of 0.31%), Uruguayan (4.6%, a difference of 0.37%), and Canadian (4.7%, a difference of 0.62%).
| Demographics | Rating | Rank | Professional Degree |
| South American Indians | 89.9 /100 | #134 | Excellent 4.8% |
| Macedonians | 89.8 /100 | #135 | Excellent 4.8% |
| Immigrants | Jordan | 89.0 /100 | #136 | Excellent 4.7% |
| Jordanians | 88.9 /100 | #137 | Excellent 4.7% |
| Afghans | 88.8 /100 | #138 | Excellent 4.7% |
| South Americans | 85.6 /100 | #139 | Excellent 4.7% |
| Canadians | 84.4 /100 | #140 | Excellent 4.7% |
| Basques | 81.8 /100 | #141 | Excellent 4.6% |
| Sudanese | 81.3 /100 | #142 | Excellent 4.6% |
| Hungarians | 80.8 /100 | #143 | Excellent 4.6% |
| Immigrants | South America | 80.5 /100 | #144 | Excellent 4.6% |
| Uruguayans | 80.2 /100 | #145 | Excellent 4.6% |
| Luxembourgers | 78.7 /100 | #146 | Good 4.6% |
| Colombians | 77.7 /100 | #147 | Good 4.6% |
| Slovenes | 76.1 /100 | #148 | Good 4.6% |
Demographics Similar to Immigrants from Philippines by Professional Degree
In terms of professional degree, the demographic groups most similar to Immigrants from Philippines are Nonimmigrants (3.9%, a difference of 0.050%), Immigrants from Barbados (3.9%, a difference of 0.050%), Cree (3.9%, a difference of 0.26%), Spanish American (3.9%, a difference of 0.28%), and Immigrants from Trinidad and Tobago (3.9%, a difference of 0.34%).
| Demographics | Rating | Rank | Professional Degree |
| German Russians | 6.1 /100 | #226 | Tragic 4.0% |
| Cubans | 5.9 /100 | #227 | Tragic 4.0% |
| Immigrants | West Indies | 5.6 /100 | #228 | Tragic 4.0% |
| Immigrants | Burma/Myanmar | 5.4 /100 | #229 | Tragic 3.9% |
| Nicaraguans | 5.1 /100 | #230 | Tragic 3.9% |
| Ecuadorians | 4.6 /100 | #231 | Tragic 3.9% |
| Cree | 4.3 /100 | #232 | Tragic 3.9% |
| Immigrants | Philippines | 4.1 /100 | #233 | Tragic 3.9% |
| Immigrants | Nonimmigrants | 4.0 /100 | #234 | Tragic 3.9% |
| Immigrants | Barbados | 4.0 /100 | #235 | Tragic 3.9% |
| Spanish Americans | 3.8 /100 | #236 | Tragic 3.9% |
| Immigrants | Trinidad and Tobago | 3.8 /100 | #237 | Tragic 3.9% |
| Colville | 2.6 /100 | #238 | Tragic 3.8% |
| British West Indians | 2.4 /100 | #239 | Tragic 3.8% |
| Immigrants | Ecuador | 2.3 /100 | #240 | Tragic 3.8% |