Basque vs Immigrants from Taiwan Professional Degree
COMPARE
Basque
Immigrants from Taiwan
Professional Degree
Professional Degree Comparison
Basques
Immigrants from Taiwan
4.6%
PROFESSIONAL DEGREE
81.8/ 100
METRIC RATING
141st/ 347
METRIC RANK
7.1%
PROFESSIONAL DEGREE
100.0/ 100
METRIC RATING
9th/ 347
METRIC RANK
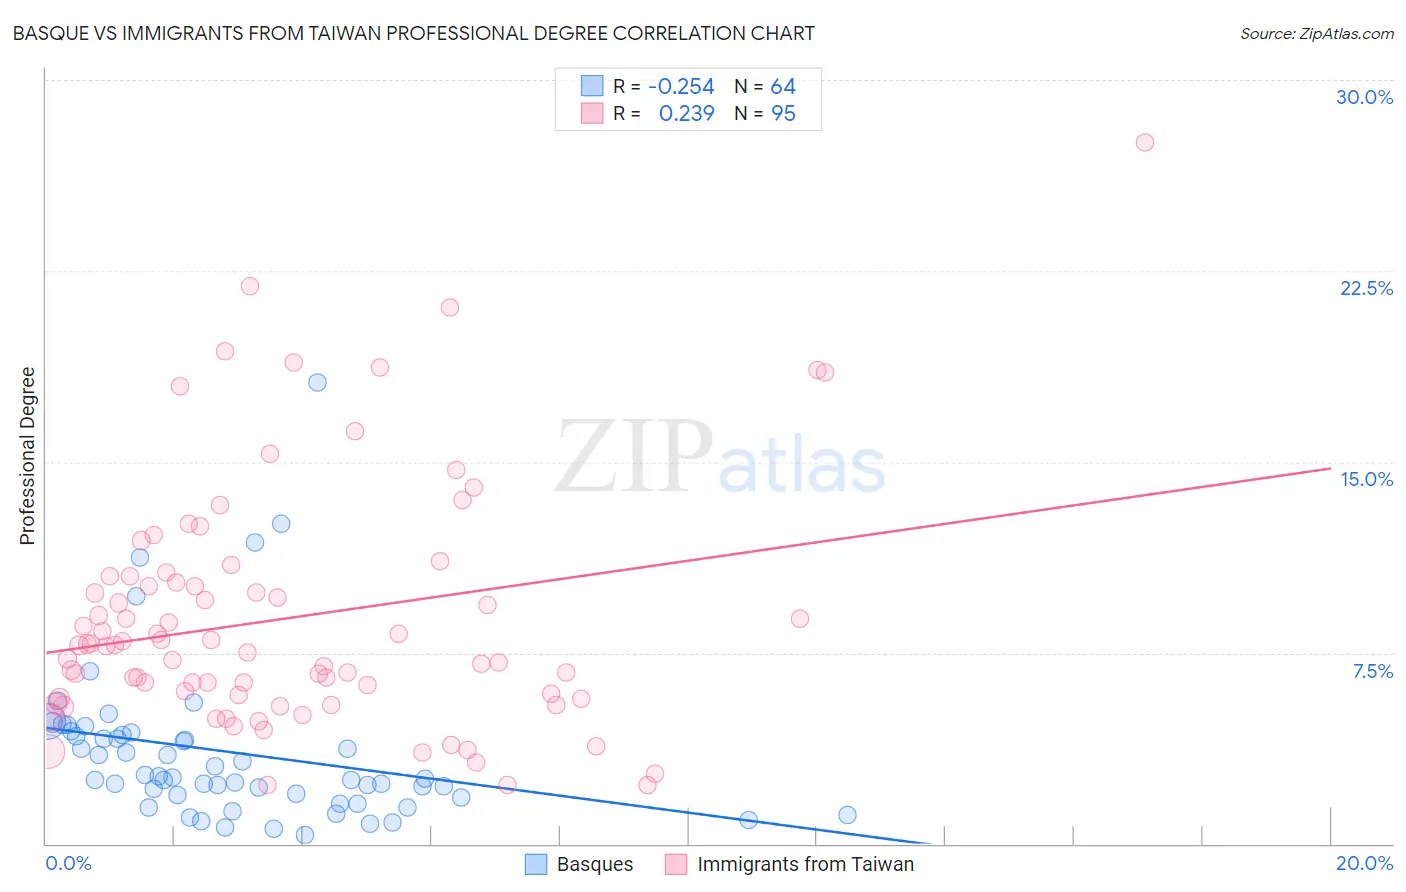
Basque vs Immigrants from Taiwan Professional Degree Correlation Chart
The statistical analysis conducted on geographies consisting of 165,605,992 people shows a weak negative correlation between the proportion of Basques and percentage of population with at least professional degree education in the United States with a correlation coefficient (R) of -0.254 and weighted average of 4.6%. Similarly, the statistical analysis conducted on geographies consisting of 298,058,509 people shows a weak positive correlation between the proportion of Immigrants from Taiwan and percentage of population with at least professional degree education in the United States with a correlation coefficient (R) of 0.239 and weighted average of 7.1%, a difference of 52.1%.
Professional Degree Correlation Summary
| Measurement | Basque | Immigrants from Taiwan |
| Minimum | 0.33% | 2.3% |
| Maximum | 18.1% | 27.6% |
| Range | 17.8% | 25.2% |
| Mean | 3.6% | 8.9% |
| Median | 2.6% | 7.8% |
| Interquartile 25% (IQ1) | 1.9% | 5.7% |
| Interquartile 75% (IQ3) | 4.3% | 10.5% |
| Interquartile Range (IQR) | 2.5% | 4.8% |
| Standard Deviation (Sample) | 3.1% | 4.8% |
| Standard Deviation (Population) | 3.1% | 4.8% |
Similar Demographics by Professional Degree
Demographics Similar to Basques by Professional Degree
In terms of professional degree, the demographic groups most similar to Basques are Sudanese (4.6%, a difference of 0.13%), Hungarian (4.6%, a difference of 0.24%), Immigrants from South America (4.6%, a difference of 0.31%), Uruguayan (4.6%, a difference of 0.37%), and Canadian (4.7%, a difference of 0.62%).
| Demographics | Rating | Rank | Professional Degree |
| South American Indians | 89.9 /100 | #134 | Excellent 4.8% |
| Macedonians | 89.8 /100 | #135 | Excellent 4.8% |
| Immigrants | Jordan | 89.0 /100 | #136 | Excellent 4.7% |
| Jordanians | 88.9 /100 | #137 | Excellent 4.7% |
| Afghans | 88.8 /100 | #138 | Excellent 4.7% |
| South Americans | 85.6 /100 | #139 | Excellent 4.7% |
| Canadians | 84.4 /100 | #140 | Excellent 4.7% |
| Basques | 81.8 /100 | #141 | Excellent 4.6% |
| Sudanese | 81.3 /100 | #142 | Excellent 4.6% |
| Hungarians | 80.8 /100 | #143 | Excellent 4.6% |
| Immigrants | South America | 80.5 /100 | #144 | Excellent 4.6% |
| Uruguayans | 80.2 /100 | #145 | Excellent 4.6% |
| Luxembourgers | 78.7 /100 | #146 | Good 4.6% |
| Colombians | 77.7 /100 | #147 | Good 4.6% |
| Slovenes | 76.1 /100 | #148 | Good 4.6% |
Demographics Similar to Immigrants from Taiwan by Professional Degree
In terms of professional degree, the demographic groups most similar to Immigrants from Taiwan are Immigrants from Switzerland (7.1%, a difference of 0.19%), Eastern European (7.1%, a difference of 0.33%), Immigrants from Belgium (7.0%, a difference of 1.7%), Cypriot (6.9%, a difference of 1.9%), and Israeli (6.9%, a difference of 2.0%).
| Demographics | Rating | Rank | Professional Degree |
| Immigrants | Singapore | 100.0 /100 | #2 | Exceptional 7.7% |
| Iranians | 100.0 /100 | #3 | Exceptional 7.6% |
| Filipinos | 100.0 /100 | #4 | Exceptional 7.6% |
| Immigrants | Iran | 100.0 /100 | #5 | Exceptional 7.3% |
| Okinawans | 100.0 /100 | #6 | Exceptional 7.3% |
| Eastern Europeans | 100.0 /100 | #7 | Exceptional 7.1% |
| Immigrants | Switzerland | 100.0 /100 | #8 | Exceptional 7.1% |
| Immigrants | Taiwan | 100.0 /100 | #9 | Exceptional 7.1% |
| Immigrants | Belgium | 100.0 /100 | #10 | Exceptional 7.0% |
| Cypriots | 100.0 /100 | #11 | Exceptional 6.9% |
| Israelis | 100.0 /100 | #12 | Exceptional 6.9% |
| Immigrants | Australia | 100.0 /100 | #13 | Exceptional 6.9% |
| Immigrants | France | 100.0 /100 | #14 | Exceptional 6.8% |
| Immigrants | China | 100.0 /100 | #15 | Exceptional 6.7% |
| Immigrants | Sweden | 100.0 /100 | #16 | Exceptional 6.7% |