Basque vs Panamanian Professional Degree
COMPARE
Basque
Panamanian
Professional Degree
Professional Degree Comparison
Basques
Panamanians
4.6%
PROFESSIONAL DEGREE
81.8/ 100
METRIC RATING
141st/ 347
METRIC RANK
4.1%
PROFESSIONAL DEGREE
15.9/ 100
METRIC RATING
203rd/ 347
METRIC RANK
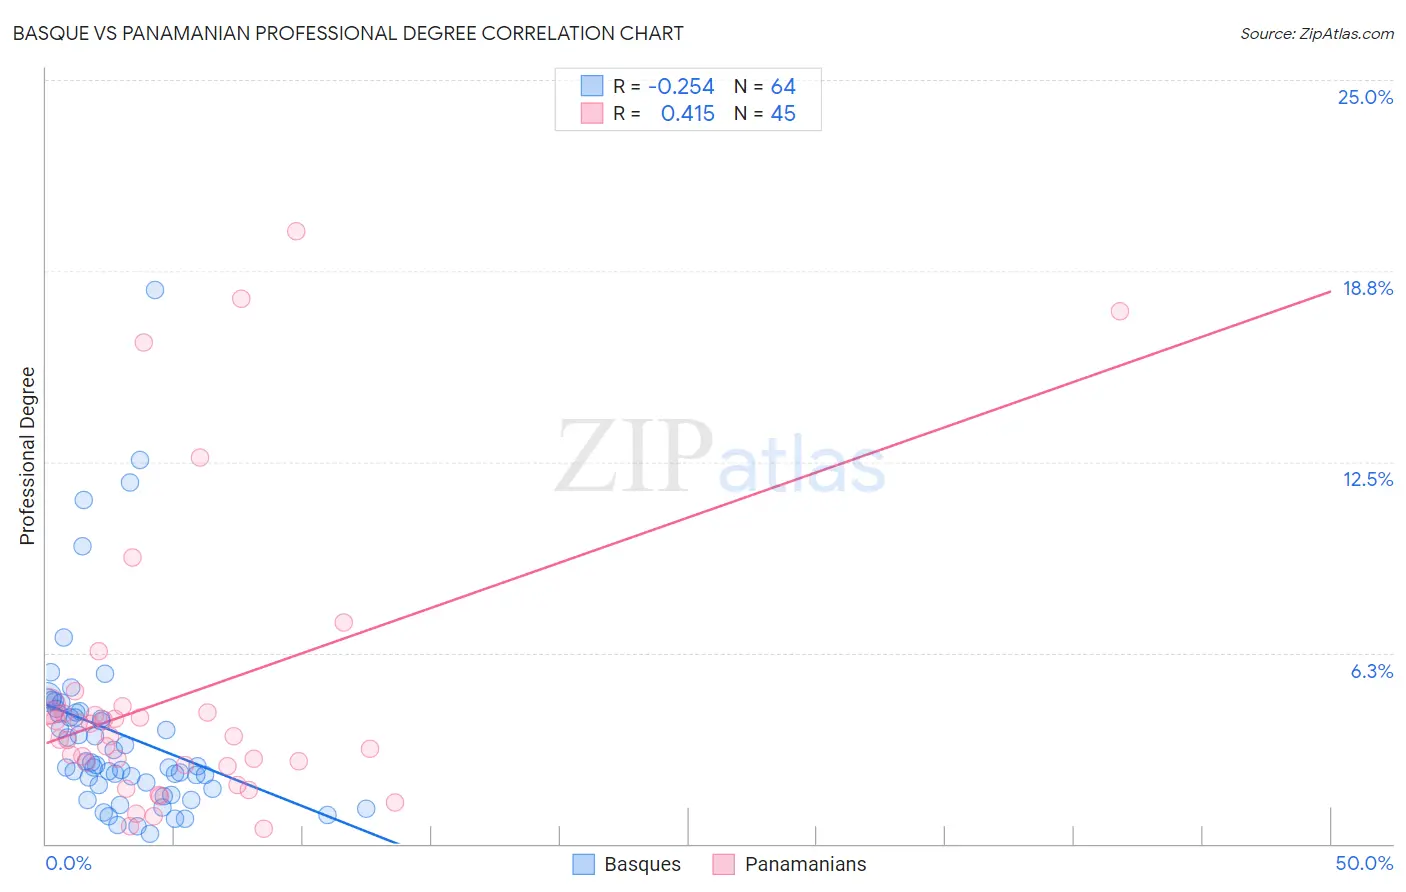
Basque vs Panamanian Professional Degree Correlation Chart
The statistical analysis conducted on geographies consisting of 165,605,992 people shows a weak negative correlation between the proportion of Basques and percentage of population with at least professional degree education in the United States with a correlation coefficient (R) of -0.254 and weighted average of 4.6%. Similarly, the statistical analysis conducted on geographies consisting of 280,833,474 people shows a moderate positive correlation between the proportion of Panamanians and percentage of population with at least professional degree education in the United States with a correlation coefficient (R) of 0.415 and weighted average of 4.1%, a difference of 12.3%.
Professional Degree Correlation Summary
| Measurement | Basque | Panamanian |
| Minimum | 0.33% | 0.49% |
| Maximum | 18.1% | 20.0% |
| Range | 17.8% | 19.6% |
| Mean | 3.6% | 4.8% |
| Median | 2.6% | 3.5% |
| Interquartile 25% (IQ1) | 1.9% | 2.6% |
| Interquartile 75% (IQ3) | 4.3% | 4.4% |
| Interquartile Range (IQR) | 2.5% | 1.8% |
| Standard Deviation (Sample) | 3.1% | 4.7% |
| Standard Deviation (Population) | 3.1% | 4.6% |
Similar Demographics by Professional Degree
Demographics Similar to Basques by Professional Degree
In terms of professional degree, the demographic groups most similar to Basques are Sudanese (4.6%, a difference of 0.13%), Hungarian (4.6%, a difference of 0.24%), Immigrants from South America (4.6%, a difference of 0.31%), Uruguayan (4.6%, a difference of 0.37%), and Canadian (4.7%, a difference of 0.62%).
| Demographics | Rating | Rank | Professional Degree |
| South American Indians | 89.9 /100 | #134 | Excellent 4.8% |
| Macedonians | 89.8 /100 | #135 | Excellent 4.8% |
| Immigrants | Jordan | 89.0 /100 | #136 | Excellent 4.7% |
| Jordanians | 88.9 /100 | #137 | Excellent 4.7% |
| Afghans | 88.8 /100 | #138 | Excellent 4.7% |
| South Americans | 85.6 /100 | #139 | Excellent 4.7% |
| Canadians | 84.4 /100 | #140 | Excellent 4.7% |
| Basques | 81.8 /100 | #141 | Excellent 4.6% |
| Sudanese | 81.3 /100 | #142 | Excellent 4.6% |
| Hungarians | 80.8 /100 | #143 | Excellent 4.6% |
| Immigrants | South America | 80.5 /100 | #144 | Excellent 4.6% |
| Uruguayans | 80.2 /100 | #145 | Excellent 4.6% |
| Luxembourgers | 78.7 /100 | #146 | Good 4.6% |
| Colombians | 77.7 /100 | #147 | Good 4.6% |
| Slovenes | 76.1 /100 | #148 | Good 4.6% |
Demographics Similar to Panamanians by Professional Degree
In terms of professional degree, the demographic groups most similar to Panamanians are Barbadian (4.1%, a difference of 0.030%), Immigrants from Iraq (4.2%, a difference of 0.33%), Somali (4.1%, a difference of 0.35%), Finnish (4.2%, a difference of 0.76%), and Yugoslavian (4.1%, a difference of 0.78%).
| Demographics | Rating | Rank | Professional Degree |
| Spanish | 23.0 /100 | #196 | Fair 4.2% |
| Czechoslovakians | 22.4 /100 | #197 | Fair 4.2% |
| Immigrants | Middle Africa | 22.1 /100 | #198 | Fair 4.2% |
| Norwegians | 20.5 /100 | #199 | Fair 4.2% |
| Immigrants | North Macedonia | 20.2 /100 | #200 | Fair 4.2% |
| Finns | 18.7 /100 | #201 | Poor 4.2% |
| Immigrants | Iraq | 17.1 /100 | #202 | Poor 4.2% |
| Panamanians | 15.9 /100 | #203 | Poor 4.1% |
| Barbadians | 15.8 /100 | #204 | Poor 4.1% |
| Somalis | 14.8 /100 | #205 | Poor 4.1% |
| Yugoslavians | 13.4 /100 | #206 | Poor 4.1% |
| Sub-Saharan Africans | 12.8 /100 | #207 | Poor 4.1% |
| Immigrants | Somalia | 12.5 /100 | #208 | Poor 4.1% |
| Immigrants | Panama | 12.3 /100 | #209 | Poor 4.1% |
| Immigrants | Nigeria | 11.7 /100 | #210 | Poor 4.1% |