Iranian vs South African Professional Degree
COMPARE
Iranian
South African
Professional Degree
Professional Degree Comparison
Iranians
South Africans
7.6%
PROFESSIONAL DEGREE
100.0/ 100
METRIC RATING
3rd/ 347
METRIC RANK
5.7%
PROFESSIONAL DEGREE
100.0/ 100
METRIC RATING
57th/ 347
METRIC RANK
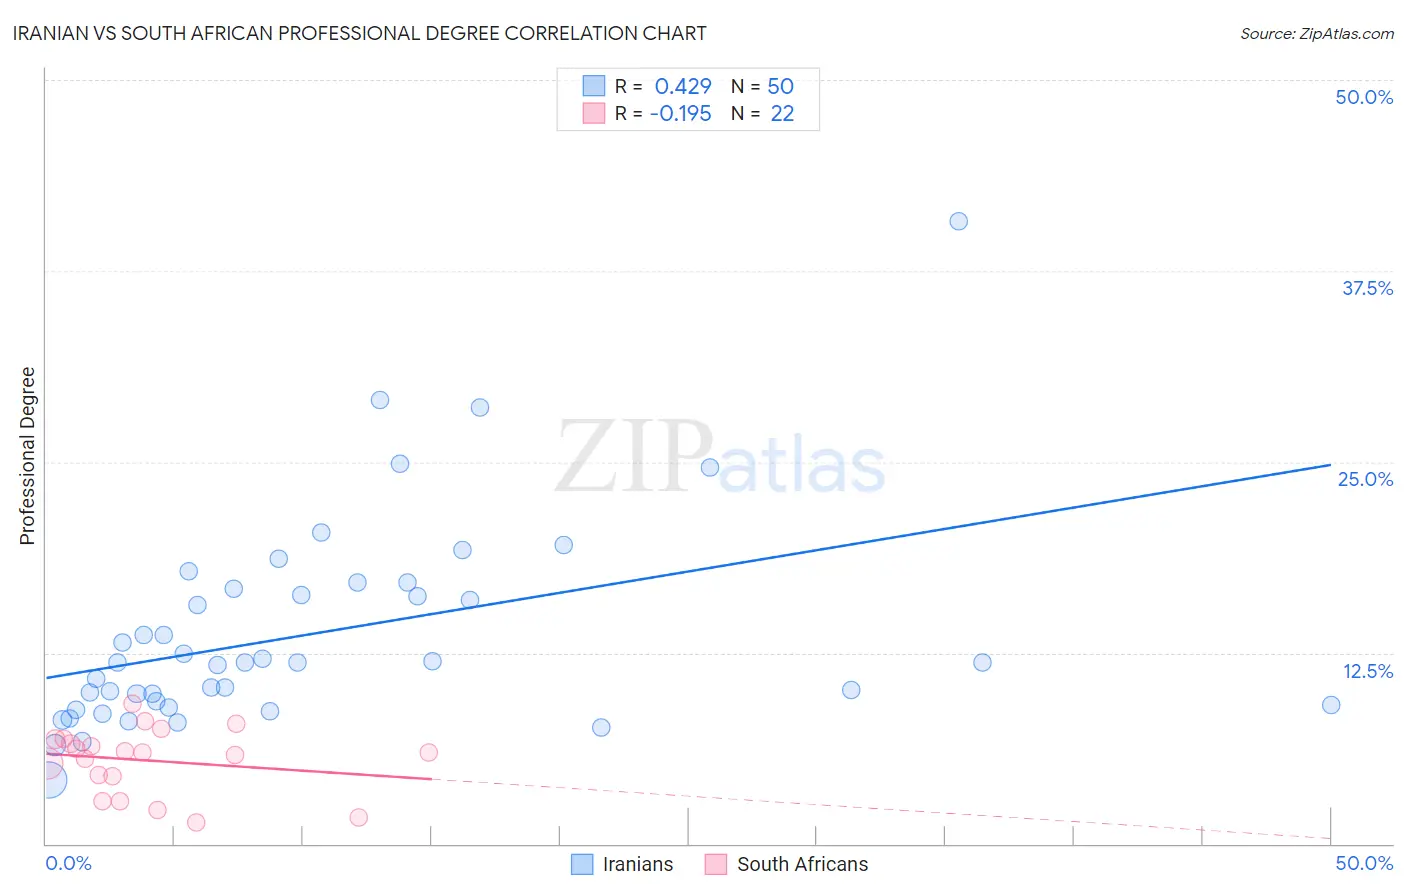
Iranian vs South African Professional Degree Correlation Chart
The statistical analysis conducted on geographies consisting of 316,586,125 people shows a moderate positive correlation between the proportion of Iranians and percentage of population with at least professional degree education in the United States with a correlation coefficient (R) of 0.429 and weighted average of 7.6%. Similarly, the statistical analysis conducted on geographies consisting of 182,499,194 people shows a poor negative correlation between the proportion of South Africans and percentage of population with at least professional degree education in the United States with a correlation coefficient (R) of -0.195 and weighted average of 5.7%, a difference of 33.8%.
Professional Degree Correlation Summary
| Measurement | Iranian | South African |
| Minimum | 4.2% | 1.4% |
| Maximum | 40.7% | 9.2% |
| Range | 36.6% | 7.8% |
| Mean | 13.7% | 5.5% |
| Median | 11.9% | 6.0% |
| Interquartile 25% (IQ1) | 9.1% | 4.5% |
| Interquartile 75% (IQ3) | 16.7% | 6.8% |
| Interquartile Range (IQR) | 7.6% | 2.4% |
| Standard Deviation (Sample) | 6.8% | 2.1% |
| Standard Deviation (Population) | 6.7% | 2.1% |
Similar Demographics by Professional Degree
Demographics Similar to Iranians by Professional Degree
In terms of professional degree, the demographic groups most similar to Iranians are Filipino (7.6%, a difference of 0.77%), Immigrants from Singapore (7.7%, a difference of 1.6%), Immigrants from Israel (7.9%, a difference of 3.1%), Immigrants from Iran (7.3%, a difference of 4.0%), and Okinawan (7.3%, a difference of 4.2%).
| Demographics | Rating | Rank | Professional Degree |
| Immigrants | Israel | 100.0 /100 | #1 | Exceptional 7.9% |
| Immigrants | Singapore | 100.0 /100 | #2 | Exceptional 7.7% |
| Iranians | 100.0 /100 | #3 | Exceptional 7.6% |
| Filipinos | 100.0 /100 | #4 | Exceptional 7.6% |
| Immigrants | Iran | 100.0 /100 | #5 | Exceptional 7.3% |
| Okinawans | 100.0 /100 | #6 | Exceptional 7.3% |
| Eastern Europeans | 100.0 /100 | #7 | Exceptional 7.1% |
| Immigrants | Switzerland | 100.0 /100 | #8 | Exceptional 7.1% |
| Immigrants | Taiwan | 100.0 /100 | #9 | Exceptional 7.1% |
| Immigrants | Belgium | 100.0 /100 | #10 | Exceptional 7.0% |
| Cypriots | 100.0 /100 | #11 | Exceptional 6.9% |
| Israelis | 100.0 /100 | #12 | Exceptional 6.9% |
| Immigrants | Australia | 100.0 /100 | #13 | Exceptional 6.9% |
| Immigrants | France | 100.0 /100 | #14 | Exceptional 6.8% |
| Immigrants | China | 100.0 /100 | #15 | Exceptional 6.7% |
Demographics Similar to South Africans by Professional Degree
In terms of professional degree, the demographic groups most similar to South Africans are Immigrants from Malaysia (5.7%, a difference of 0.26%), Immigrants from Western Europe (5.7%, a difference of 0.38%), Bulgarian (5.7%, a difference of 0.59%), Immigrants from Kuwait (5.7%, a difference of 0.79%), and Immigrants from Europe (5.6%, a difference of 1.1%).
| Demographics | Rating | Rank | Professional Degree |
| Immigrants | Czechoslovakia | 100.0 /100 | #50 | Exceptional 5.8% |
| Immigrants | Greece | 100.0 /100 | #51 | Exceptional 5.8% |
| Immigrants | Serbia | 100.0 /100 | #52 | Exceptional 5.8% |
| Immigrants | Netherlands | 100.0 /100 | #53 | Exceptional 5.8% |
| Immigrants | Kuwait | 100.0 /100 | #54 | Exceptional 5.7% |
| Immigrants | Western Europe | 100.0 /100 | #55 | Exceptional 5.7% |
| Immigrants | Malaysia | 100.0 /100 | #56 | Exceptional 5.7% |
| South Africans | 100.0 /100 | #57 | Exceptional 5.7% |
| Bulgarians | 100.0 /100 | #58 | Exceptional 5.7% |
| Immigrants | Europe | 100.0 /100 | #59 | Exceptional 5.6% |
| Bolivians | 99.9 /100 | #60 | Exceptional 5.6% |
| Immigrants | Lithuania | 99.9 /100 | #61 | Exceptional 5.6% |
| Immigrants | Belarus | 99.9 /100 | #62 | Exceptional 5.5% |
| Asians | 99.9 /100 | #63 | Exceptional 5.5% |
| Immigrants | Asia | 99.9 /100 | #64 | Exceptional 5.5% |