Mongolian vs Hmong 11th Grade
COMPARE
Mongolian
Hmong
11th Grade
11th Grade Comparison
Mongolians
Hmong
93.0%
11TH GRADE
87.6/ 100
METRIC RATING
133rd/ 347
METRIC RANK
92.8%
11TH GRADE
78.6/ 100
METRIC RATING
148th/ 347
METRIC RANK
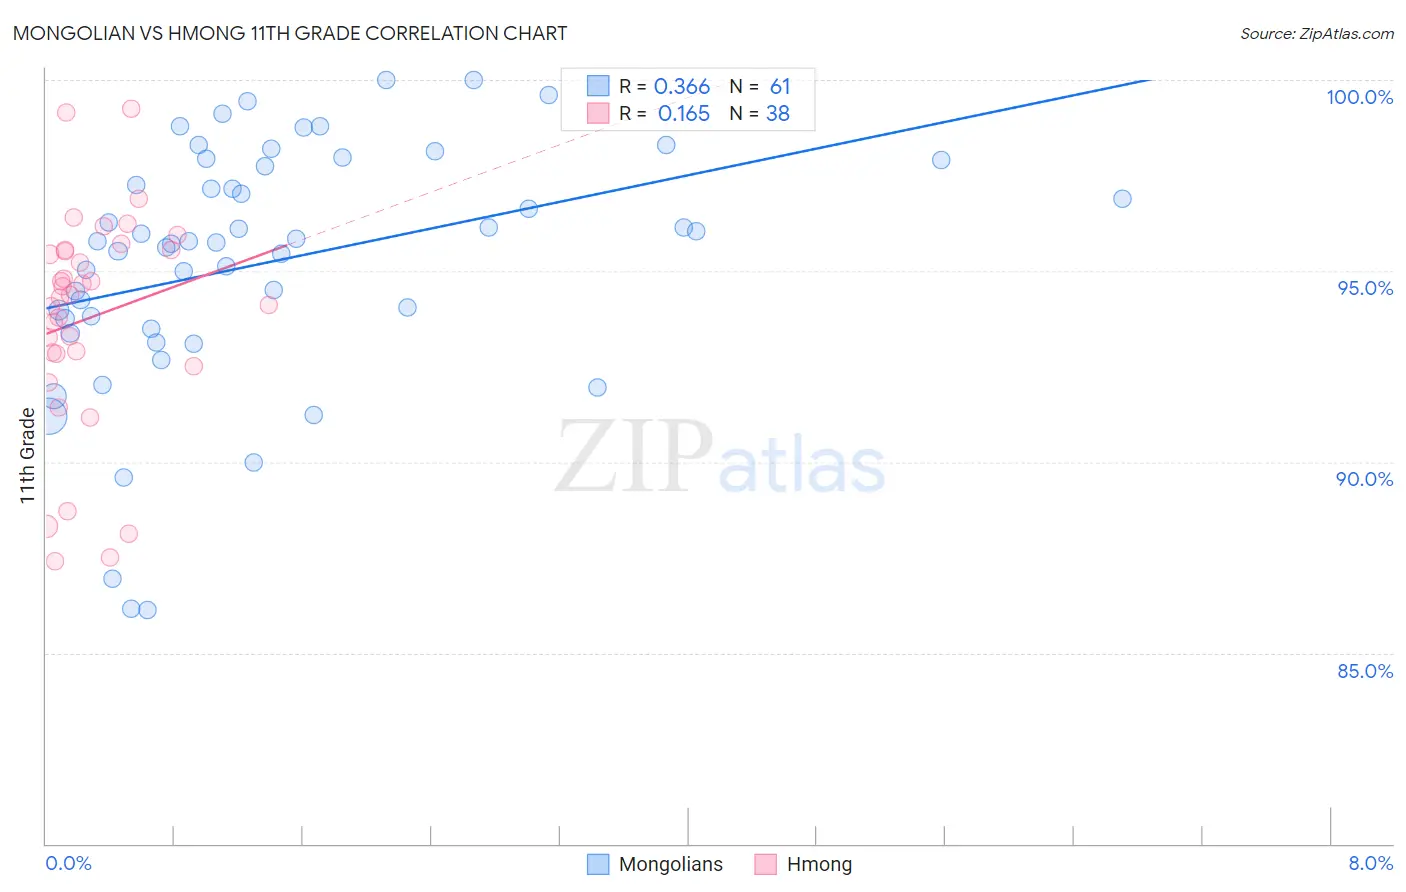
Mongolian vs Hmong 11th Grade Correlation Chart
The statistical analysis conducted on geographies consisting of 140,362,004 people shows a mild positive correlation between the proportion of Mongolians and percentage of population with at least 11th grade education in the United States with a correlation coefficient (R) of 0.366 and weighted average of 93.0%. Similarly, the statistical analysis conducted on geographies consisting of 24,672,093 people shows a poor positive correlation between the proportion of Hmong and percentage of population with at least 11th grade education in the United States with a correlation coefficient (R) of 0.165 and weighted average of 92.8%, a difference of 0.16%.
11th Grade Correlation Summary
| Measurement | Mongolian | Hmong |
| Minimum | 86.1% | 87.4% |
| Maximum | 100.0% | 99.2% |
| Range | 13.9% | 11.9% |
| Mean | 95.2% | 93.8% |
| Median | 95.8% | 94.3% |
| Interquartile 25% (IQ1) | 93.6% | 92.8% |
| Interquartile 75% (IQ3) | 97.8% | 95.5% |
| Interquartile Range (IQR) | 4.2% | 2.7% |
| Standard Deviation (Sample) | 3.2% | 2.9% |
| Standard Deviation (Population) | 3.2% | 2.8% |
Demographics Similar to Mongolians and Hmong by 11th Grade
In terms of 11th grade, the demographic groups most similar to Mongolians are Delaware (93.0%, a difference of 0.010%), Immigrants from Italy (92.9%, a difference of 0.020%), Immigrants from Bosnia and Herzegovina (93.0%, a difference of 0.030%), Cree (92.9%, a difference of 0.030%), and Arab (92.9%, a difference of 0.040%). Similarly, the demographic groups most similar to Hmong are Immigrants from Kenya (92.8%, a difference of 0.0%), Immigrants from Poland (92.8%, a difference of 0.0%), Iroquois (92.8%, a difference of 0.010%), Pakistani (92.8%, a difference of 0.020%), and Immigrants from Egypt (92.8%, a difference of 0.020%).
| Demographics | Rating | Rank | 11th Grade |
| Albanians | 89.5 /100 | #130 | Excellent 93.0% |
| Egyptians | 89.5 /100 | #131 | Excellent 93.0% |
| Immigrants | Bosnia and Herzegovina | 89.0 /100 | #132 | Excellent 93.0% |
| Mongolians | 87.6 /100 | #133 | Excellent 93.0% |
| Delaware | 87.3 /100 | #134 | Excellent 93.0% |
| Immigrants | Italy | 86.6 /100 | #135 | Excellent 92.9% |
| Cree | 85.9 /100 | #136 | Excellent 92.9% |
| Arabs | 85.4 /100 | #137 | Excellent 92.9% |
| Immigrants | Brazil | 85.1 /100 | #138 | Excellent 92.9% |
| Crow | 84.1 /100 | #139 | Excellent 92.9% |
| Venezuelans | 83.4 /100 | #140 | Excellent 92.9% |
| Chileans | 83.0 /100 | #141 | Excellent 92.9% |
| Kenyans | 82.0 /100 | #142 | Excellent 92.9% |
| Ugandans | 81.4 /100 | #143 | Excellent 92.9% |
| Assyrians/Chaldeans/Syriacs | 80.5 /100 | #144 | Excellent 92.8% |
| Pakistanis | 79.6 /100 | #145 | Good 92.8% |
| Iroquois | 79.1 /100 | #146 | Good 92.8% |
| Immigrants | Kenya | 78.7 /100 | #147 | Good 92.8% |
| Hmong | 78.6 /100 | #148 | Good 92.8% |
| Immigrants | Poland | 78.5 /100 | #149 | Good 92.8% |
| Immigrants | Egypt | 77.5 /100 | #150 | Good 92.8% |