Malaysian vs Hmong 11th Grade
COMPARE
Malaysian
Hmong
11th Grade
11th Grade Comparison
Malaysians
Hmong
90.8%
11TH GRADE
0.1/ 100
METRIC RATING
278th/ 347
METRIC RANK
92.8%
11TH GRADE
78.6/ 100
METRIC RATING
148th/ 347
METRIC RANK
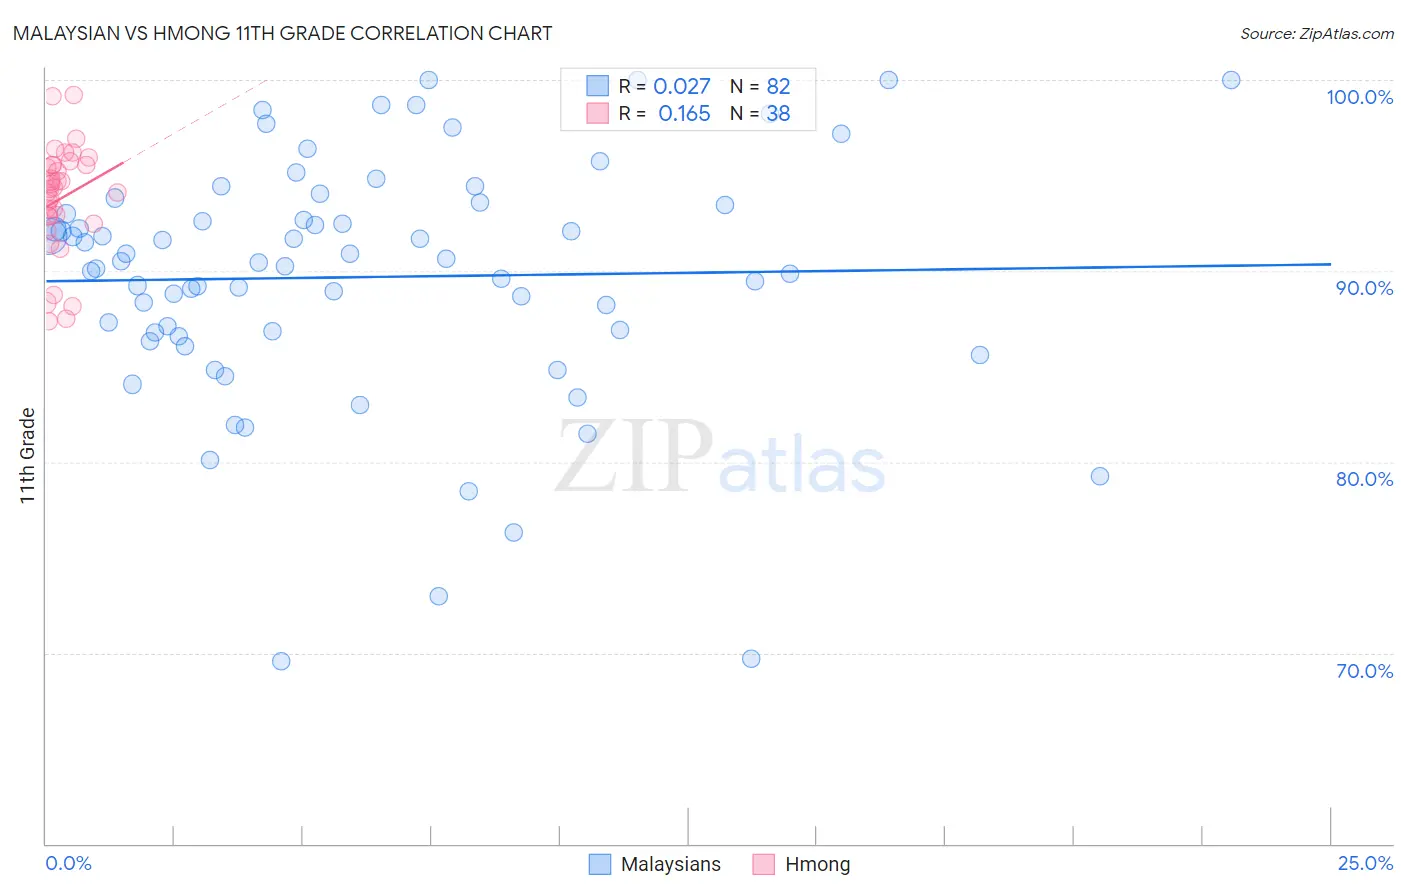
Malaysian vs Hmong 11th Grade Correlation Chart
The statistical analysis conducted on geographies consisting of 226,109,984 people shows no correlation between the proportion of Malaysians and percentage of population with at least 11th grade education in the United States with a correlation coefficient (R) of 0.027 and weighted average of 90.8%. Similarly, the statistical analysis conducted on geographies consisting of 24,672,093 people shows a poor positive correlation between the proportion of Hmong and percentage of population with at least 11th grade education in the United States with a correlation coefficient (R) of 0.165 and weighted average of 92.8%, a difference of 2.2%.
11th Grade Correlation Summary
| Measurement | Malaysian | Hmong |
| Minimum | 69.5% | 87.4% |
| Maximum | 100.0% | 99.2% |
| Range | 30.5% | 11.9% |
| Mean | 89.7% | 93.8% |
| Median | 90.5% | 94.3% |
| Interquartile 25% (IQ1) | 86.8% | 92.8% |
| Interquartile 75% (IQ3) | 93.5% | 95.5% |
| Interquartile Range (IQR) | 6.7% | 2.7% |
| Standard Deviation (Sample) | 6.4% | 2.9% |
| Standard Deviation (Population) | 6.4% | 2.8% |
Similar Demographics by 11th Grade
Demographics Similar to Malaysians by 11th Grade
In terms of 11th grade, the demographic groups most similar to Malaysians are Immigrants from Congo (90.9%, a difference of 0.040%), Barbadian (90.8%, a difference of 0.040%), Bangladeshi (90.9%, a difference of 0.050%), Sri Lankan (90.7%, a difference of 0.11%), and Immigrants from South Eastern Asia (90.9%, a difference of 0.13%).
| Demographics | Rating | Rank | 11th Grade |
| Immigrants | Peru | 0.1 /100 | #271 | Tragic 91.0% |
| West Indians | 0.1 /100 | #272 | Tragic 91.0% |
| Paiute | 0.1 /100 | #273 | Tragic 91.0% |
| Immigrants | Trinidad and Tobago | 0.1 /100 | #274 | Tragic 90.9% |
| Immigrants | South Eastern Asia | 0.1 /100 | #275 | Tragic 90.9% |
| Bangladeshis | 0.1 /100 | #276 | Tragic 90.9% |
| Immigrants | Congo | 0.1 /100 | #277 | Tragic 90.9% |
| Malaysians | 0.1 /100 | #278 | Tragic 90.8% |
| Barbadians | 0.0 /100 | #279 | Tragic 90.8% |
| Sri Lankans | 0.0 /100 | #280 | Tragic 90.7% |
| Dutch West Indians | 0.0 /100 | #281 | Tragic 90.7% |
| Immigrants | St. Vincent and the Grenadines | 0.0 /100 | #282 | Tragic 90.7% |
| Immigrants | Barbados | 0.0 /100 | #283 | Tragic 90.7% |
| Immigrants | Laos | 0.0 /100 | #284 | Tragic 90.5% |
| Immigrants | Burma/Myanmar | 0.0 /100 | #285 | Tragic 90.4% |
Demographics Similar to Hmong by 11th Grade
In terms of 11th grade, the demographic groups most similar to Hmong are Immigrants from Kenya (92.8%, a difference of 0.0%), Immigrants from Poland (92.8%, a difference of 0.0%), Iroquois (92.8%, a difference of 0.010%), Pakistani (92.8%, a difference of 0.020%), and Immigrants from Egypt (92.8%, a difference of 0.020%).
| Demographics | Rating | Rank | 11th Grade |
| Chileans | 83.0 /100 | #141 | Excellent 92.9% |
| Kenyans | 82.0 /100 | #142 | Excellent 92.9% |
| Ugandans | 81.4 /100 | #143 | Excellent 92.9% |
| Assyrians/Chaldeans/Syriacs | 80.5 /100 | #144 | Excellent 92.8% |
| Pakistanis | 79.6 /100 | #145 | Good 92.8% |
| Iroquois | 79.1 /100 | #146 | Good 92.8% |
| Immigrants | Kenya | 78.7 /100 | #147 | Good 92.8% |
| Hmong | 78.6 /100 | #148 | Good 92.8% |
| Immigrants | Poland | 78.5 /100 | #149 | Good 92.8% |
| Immigrants | Egypt | 77.5 /100 | #150 | Good 92.8% |
| Potawatomi | 74.3 /100 | #151 | Good 92.8% |
| Iraqis | 74.2 /100 | #152 | Good 92.8% |
| Brazilians | 73.9 /100 | #153 | Good 92.8% |
| Osage | 73.4 /100 | #154 | Good 92.7% |
| Argentineans | 73.4 /100 | #155 | Good 92.7% |