Basque vs Luxembourger 4th Grade
COMPARE
Basque
Luxembourger
4th Grade
4th Grade Comparison
Basques
Luxembourgers
97.8%
4TH GRADE
95.8/ 100
METRIC RATING
113th/ 347
METRIC RANK
98.2%
4TH GRADE
99.9/ 100
METRIC RATING
40th/ 347
METRIC RANK
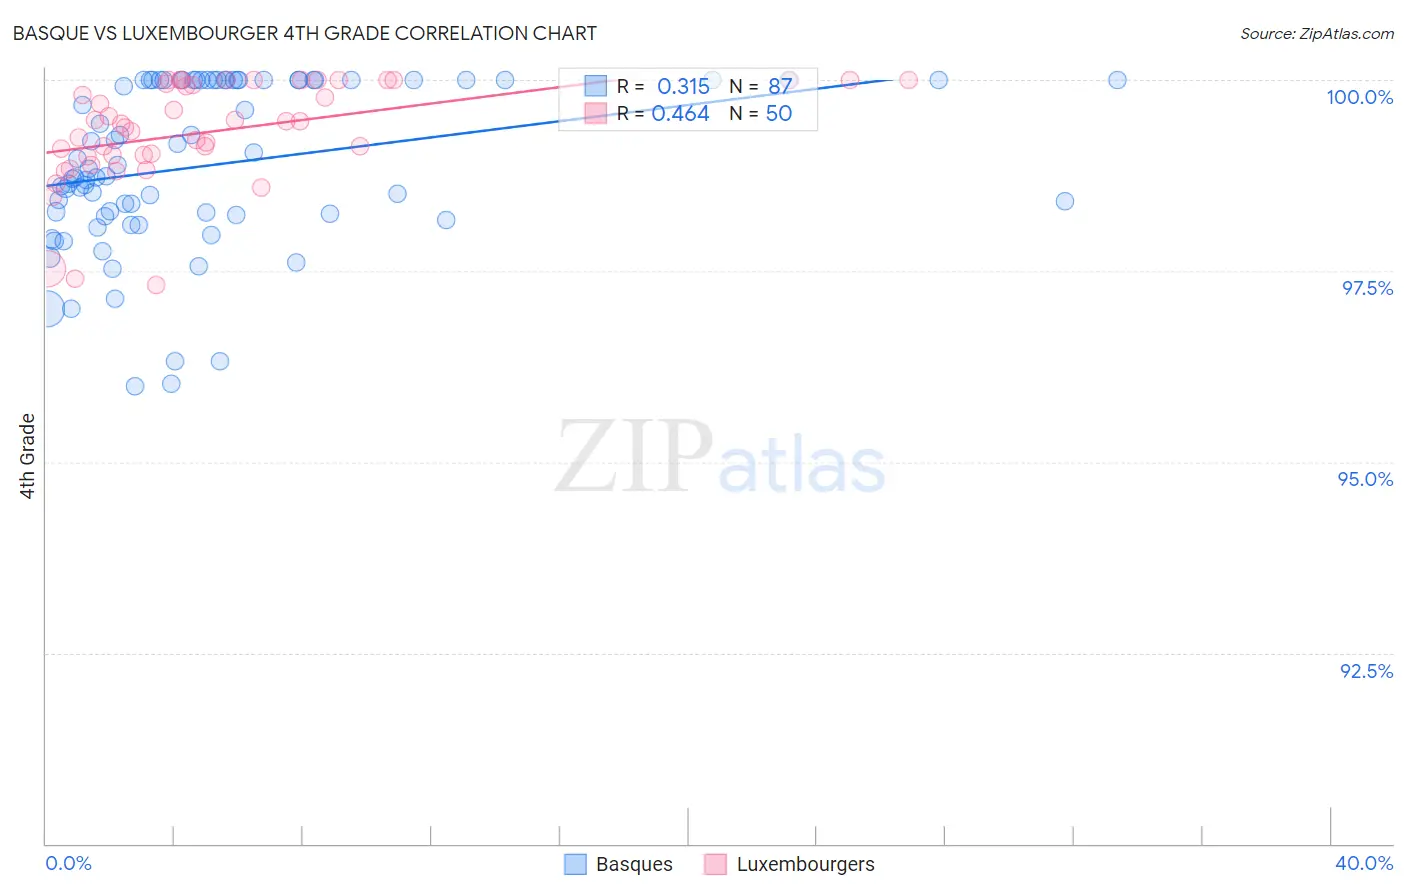
Basque vs Luxembourger 4th Grade Correlation Chart
The statistical analysis conducted on geographies consisting of 165,774,137 people shows a mild positive correlation between the proportion of Basques and percentage of population with at least 4th grade education in the United States with a correlation coefficient (R) of 0.315 and weighted average of 97.8%. Similarly, the statistical analysis conducted on geographies consisting of 144,675,126 people shows a moderate positive correlation between the proportion of Luxembourgers and percentage of population with at least 4th grade education in the United States with a correlation coefficient (R) of 0.464 and weighted average of 98.2%, a difference of 0.39%.
4th Grade Correlation Summary
| Measurement | Basque | Luxembourger |
| Minimum | 96.0% | 97.3% |
| Maximum | 100.0% | 100.0% |
| Range | 4.0% | 2.7% |
| Mean | 98.9% | 99.3% |
| Median | 98.8% | 99.4% |
| Interquartile 25% (IQ1) | 98.2% | 99.0% |
| Interquartile 75% (IQ3) | 100.0% | 100.0% |
| Interquartile Range (IQR) | 1.8% | 0.99% |
| Standard Deviation (Sample) | 1.1% | 0.67% |
| Standard Deviation (Population) | 1.1% | 0.67% |
Similar Demographics by 4th Grade
Demographics Similar to Basques by 4th Grade
In terms of 4th grade, the demographic groups most similar to Basques are Okinawan (97.8%, a difference of 0.0%), Immigrants from Switzerland (97.8%, a difference of 0.010%), Iroquois (97.8%, a difference of 0.010%), Lebanese (97.8%, a difference of 0.010%), and Immigrants from Croatia (97.8%, a difference of 0.010%).
| Demographics | Rating | Rank | 4th Grade |
| Immigrants | Czechoslovakia | 97.5 /100 | #106 | Exceptional 97.9% |
| Bhutanese | 97.4 /100 | #107 | Exceptional 97.9% |
| Immigrants | Singapore | 97.3 /100 | #108 | Exceptional 97.9% |
| Immigrants | Latvia | 96.8 /100 | #109 | Exceptional 97.8% |
| Thais | 96.7 /100 | #110 | Exceptional 97.8% |
| Immigrants | Switzerland | 96.1 /100 | #111 | Exceptional 97.8% |
| Okinawans | 96.0 /100 | #112 | Exceptional 97.8% |
| Basques | 95.8 /100 | #113 | Exceptional 97.8% |
| Iroquois | 95.4 /100 | #114 | Exceptional 97.8% |
| Lebanese | 95.4 /100 | #115 | Exceptional 97.8% |
| Immigrants | Croatia | 95.2 /100 | #116 | Exceptional 97.8% |
| Syrians | 94.9 /100 | #117 | Exceptional 97.8% |
| Menominee | 94.9 /100 | #118 | Exceptional 97.8% |
| Immigrants | Saudi Arabia | 94.8 /100 | #119 | Exceptional 97.8% |
| Immigrants | France | 94.8 /100 | #120 | Exceptional 97.8% |
Demographics Similar to Luxembourgers by 4th Grade
In terms of 4th grade, the demographic groups most similar to Luxembourgers are Belgian (98.2%, a difference of 0.0%), Eastern European (98.2%, a difference of 0.0%), Latvian (98.2%, a difference of 0.010%), Aleut (98.2%, a difference of 0.010%), and British (98.2%, a difference of 0.030%).
| Demographics | Rating | Rank | 4th Grade |
| Swiss | 100.0 /100 | #33 | Exceptional 98.2% |
| Chippewa | 100.0 /100 | #34 | Exceptional 98.2% |
| Italians | 100.0 /100 | #35 | Exceptional 98.2% |
| British | 100.0 /100 | #36 | Exceptional 98.2% |
| Latvians | 99.9 /100 | #37 | Exceptional 98.2% |
| Aleuts | 99.9 /100 | #38 | Exceptional 98.2% |
| Belgians | 99.9 /100 | #39 | Exceptional 98.2% |
| Luxembourgers | 99.9 /100 | #40 | Exceptional 98.2% |
| Eastern Europeans | 99.9 /100 | #41 | Exceptional 98.2% |
| Hungarians | 99.9 /100 | #42 | Exceptional 98.2% |
| Northern Europeans | 99.9 /100 | #43 | Exceptional 98.2% |
| Native Hawaiians | 99.9 /100 | #44 | Exceptional 98.1% |
| Czechoslovakians | 99.9 /100 | #45 | Exceptional 98.1% |
| Ottawa | 99.9 /100 | #46 | Exceptional 98.1% |
| Arapaho | 99.9 /100 | #47 | Exceptional 98.1% |