Basque vs Argentinean 4th Grade
COMPARE
Basque
Argentinean
4th Grade
4th Grade Comparison
Basques
Argentineans
97.8%
4TH GRADE
95.8/ 100
METRIC RATING
113th/ 347
METRIC RANK
97.5%
4TH GRADE
39.0/ 100
METRIC RATING
183rd/ 347
METRIC RANK
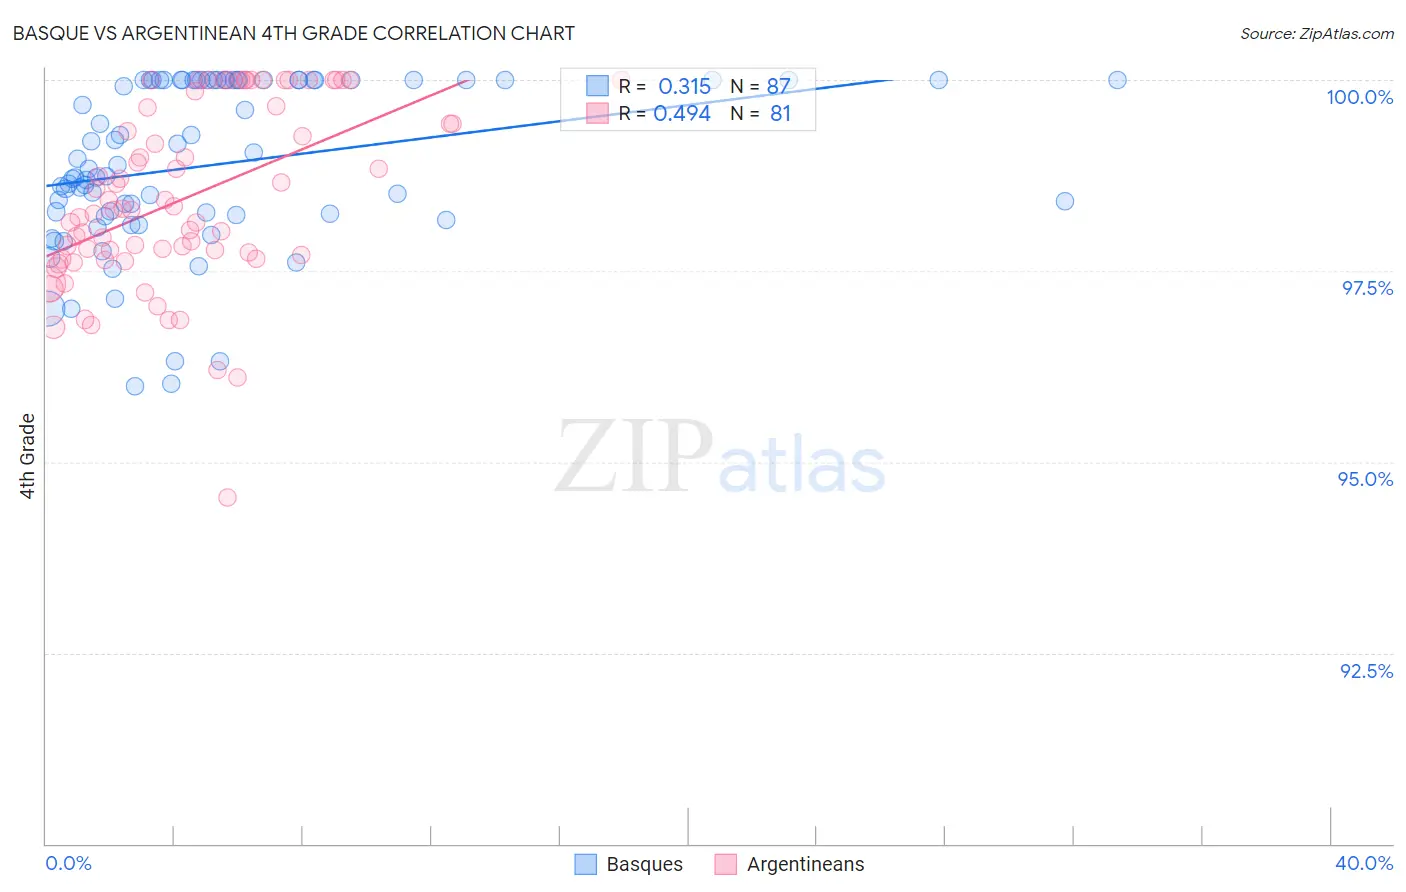
Basque vs Argentinean 4th Grade Correlation Chart
The statistical analysis conducted on geographies consisting of 165,774,137 people shows a mild positive correlation between the proportion of Basques and percentage of population with at least 4th grade education in the United States with a correlation coefficient (R) of 0.315 and weighted average of 97.8%. Similarly, the statistical analysis conducted on geographies consisting of 297,143,222 people shows a moderate positive correlation between the proportion of Argentineans and percentage of population with at least 4th grade education in the United States with a correlation coefficient (R) of 0.494 and weighted average of 97.5%, a difference of 0.34%.
4th Grade Correlation Summary
| Measurement | Basque | Argentinean |
| Minimum | 96.0% | 94.5% |
| Maximum | 100.0% | 100.0% |
| Range | 4.0% | 5.5% |
| Mean | 98.9% | 98.5% |
| Median | 98.8% | 98.3% |
| Interquartile 25% (IQ1) | 98.2% | 97.7% |
| Interquartile 75% (IQ3) | 100.0% | 99.7% |
| Interquartile Range (IQR) | 1.8% | 2.0% |
| Standard Deviation (Sample) | 1.1% | 1.2% |
| Standard Deviation (Population) | 1.1% | 1.2% |
Similar Demographics by 4th Grade
Demographics Similar to Basques by 4th Grade
In terms of 4th grade, the demographic groups most similar to Basques are Okinawan (97.8%, a difference of 0.0%), Immigrants from Switzerland (97.8%, a difference of 0.010%), Iroquois (97.8%, a difference of 0.010%), Lebanese (97.8%, a difference of 0.010%), and Immigrants from Croatia (97.8%, a difference of 0.010%).
| Demographics | Rating | Rank | 4th Grade |
| Immigrants | Czechoslovakia | 97.5 /100 | #106 | Exceptional 97.9% |
| Bhutanese | 97.4 /100 | #107 | Exceptional 97.9% |
| Immigrants | Singapore | 97.3 /100 | #108 | Exceptional 97.9% |
| Immigrants | Latvia | 96.8 /100 | #109 | Exceptional 97.8% |
| Thais | 96.7 /100 | #110 | Exceptional 97.8% |
| Immigrants | Switzerland | 96.1 /100 | #111 | Exceptional 97.8% |
| Okinawans | 96.0 /100 | #112 | Exceptional 97.8% |
| Basques | 95.8 /100 | #113 | Exceptional 97.8% |
| Iroquois | 95.4 /100 | #114 | Exceptional 97.8% |
| Lebanese | 95.4 /100 | #115 | Exceptional 97.8% |
| Immigrants | Croatia | 95.2 /100 | #116 | Exceptional 97.8% |
| Syrians | 94.9 /100 | #117 | Exceptional 97.8% |
| Menominee | 94.9 /100 | #118 | Exceptional 97.8% |
| Immigrants | Saudi Arabia | 94.8 /100 | #119 | Exceptional 97.8% |
| Immigrants | France | 94.8 /100 | #120 | Exceptional 97.8% |
Demographics Similar to Argentineans by 4th Grade
In terms of 4th grade, the demographic groups most similar to Argentineans are Spanish American (97.5%, a difference of 0.0%), Immigrants from Venezuela (97.5%, a difference of 0.010%), Immigrants from Taiwan (97.5%, a difference of 0.010%), Pakistani (97.5%, a difference of 0.010%), and Immigrants from Kenya (97.5%, a difference of 0.010%).
| Demographics | Rating | Rank | 4th Grade |
| Arabs | 48.7 /100 | #176 | Average 97.5% |
| Immigrants | Brazil | 46.1 /100 | #177 | Average 97.5% |
| Comanche | 45.3 /100 | #178 | Average 97.5% |
| Immigrants | Kazakhstan | 43.6 /100 | #179 | Average 97.5% |
| Immigrants | Venezuela | 42.7 /100 | #180 | Average 97.5% |
| Immigrants | Taiwan | 41.5 /100 | #181 | Average 97.5% |
| Spanish Americans | 39.3 /100 | #182 | Fair 97.5% |
| Argentineans | 39.0 /100 | #183 | Fair 97.5% |
| Pakistanis | 36.2 /100 | #184 | Fair 97.5% |
| Immigrants | Kenya | 35.8 /100 | #185 | Fair 97.5% |
| Dutch West Indians | 35.8 /100 | #186 | Fair 97.5% |
| Mongolians | 34.7 /100 | #187 | Fair 97.5% |
| Immigrants | Argentina | 34.6 /100 | #188 | Fair 97.5% |
| Panamanians | 31.9 /100 | #189 | Fair 97.4% |
| Blacks/African Americans | 31.1 /100 | #190 | Fair 97.4% |