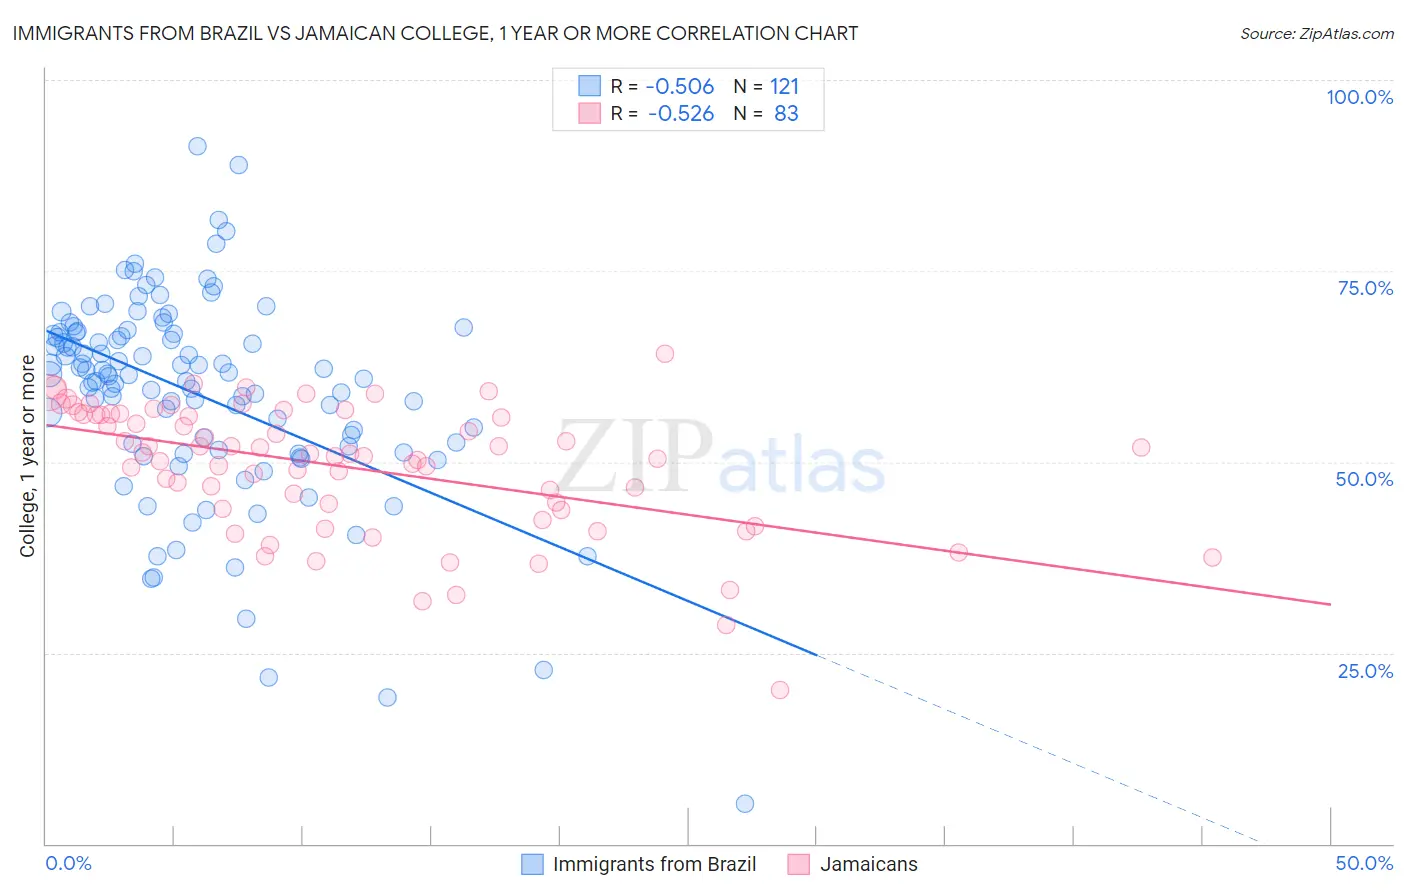
Immigrants from Brazil vs Jamaican College, 1 year or more
COMPARE
Immigrants from Brazil
Jamaican
College, 1 year or more
College, 1 year or more Comparison
Immigrants from Brazil
Jamaicans
61.6%
COLLEGE, 1 YEAR OR MORE
93.9/ 100
METRIC RATING
118th/ 347
METRIC RANK
54.9%
COLLEGE, 1 YEAR OR MORE
0.3/ 100
METRIC RATING
260th/ 347
METRIC RANK
Immigrants from Brazil vs Jamaican College, 1 year or more Correlation Chart
The statistical analysis conducted on geographies consisting of 343,021,697 people shows a substantial negative correlation between the proportion of Immigrants from Brazil and percentage of population with at least college, 1 year or more education in the United States with a correlation coefficient (R) of -0.506 and weighted average of 61.6%. Similarly, the statistical analysis conducted on geographies consisting of 368,077,485 people shows a substantial negative correlation between the proportion of Jamaicans and percentage of population with at least college, 1 year or more education in the United States with a correlation coefficient (R) of -0.526 and weighted average of 54.9%, a difference of 12.2%.
College, 1 year or more Correlation Summary
| Measurement | Immigrants from Brazil | Jamaican |
| Minimum | 5.3% | 20.1% |
| Maximum | 91.3% | 64.1% |
| Range | 86.0% | 44.0% |
| Mean | 58.8% | 49.3% |
| Median | 61.4% | 51.0% |
| Interquartile 25% (IQ1) | 51.8% | 43.8% |
| Interquartile 75% (IQ3) | 66.8% | 56.2% |
| Interquartile Range (IQR) | 15.0% | 12.4% |
| Standard Deviation (Sample) | 13.5% | 8.5% |
| Standard Deviation (Population) | 13.4% | 8.4% |
Similar Demographics by College, 1 year or more
Demographics Similar to Immigrants from Brazil by College, 1 year or more
In terms of college, 1 year or more, the demographic groups most similar to Immigrants from Brazil are Arab (61.6%, a difference of 0.0%), Lebanese (61.6%, a difference of 0.050%), Assyrian/Chaldean/Syriac (61.5%, a difference of 0.13%), Pakistani (61.5%, a difference of 0.14%), and Norwegian (61.7%, a difference of 0.15%).
| Demographics | Rating | Rank | College, 1 year or more |
| Macedonians | 95.6 /100 | #111 | Exceptional 61.8% |
| Austrians | 95.4 /100 | #112 | Exceptional 61.8% |
| Ukrainians | 95.2 /100 | #113 | Exceptional 61.8% |
| Danes | 94.8 /100 | #114 | Exceptional 61.7% |
| Norwegians | 94.5 /100 | #115 | Exceptional 61.7% |
| Lebanese | 94.1 /100 | #116 | Exceptional 61.6% |
| Arabs | 93.9 /100 | #117 | Exceptional 61.6% |
| Immigrants | Brazil | 93.9 /100 | #118 | Exceptional 61.6% |
| Assyrians/Chaldeans/Syriacs | 93.3 /100 | #119 | Exceptional 61.5% |
| Pakistanis | 93.2 /100 | #120 | Exceptional 61.5% |
| Immigrants | Jordan | 92.7 /100 | #121 | Exceptional 61.4% |
| Immigrants | Chile | 92.3 /100 | #122 | Exceptional 61.4% |
| Serbians | 92.2 /100 | #123 | Exceptional 61.4% |
| Venezuelans | 92.1 /100 | #124 | Exceptional 61.3% |
| Immigrants | Syria | 91.6 /100 | #125 | Exceptional 61.3% |
Demographics Similar to Jamaicans by College, 1 year or more
In terms of college, 1 year or more, the demographic groups most similar to Jamaicans are Ottawa (54.9%, a difference of 0.030%), Nepalese (54.9%, a difference of 0.10%), Immigrants from St. Vincent and the Grenadines (54.8%, a difference of 0.11%), U.S. Virgin Islander (54.8%, a difference of 0.13%), and African (55.0%, a difference of 0.16%).
| Demographics | Rating | Rank | College, 1 year or more |
| Immigrants | Barbados | 0.6 /100 | #253 | Tragic 55.4% |
| Japanese | 0.5 /100 | #254 | Tragic 55.2% |
| Immigrants | Bahamas | 0.5 /100 | #255 | Tragic 55.2% |
| Immigrants | West Indies | 0.5 /100 | #256 | Tragic 55.2% |
| Indonesians | 0.4 /100 | #257 | Tragic 55.1% |
| Africans | 0.4 /100 | #258 | Tragic 55.0% |
| Nepalese | 0.3 /100 | #259 | Tragic 54.9% |
| Jamaicans | 0.3 /100 | #260 | Tragic 54.9% |
| Ottawa | 0.3 /100 | #261 | Tragic 54.9% |
| Immigrants | St. Vincent and the Grenadines | 0.3 /100 | #262 | Tragic 54.8% |
| U.S. Virgin Islanders | 0.3 /100 | #263 | Tragic 54.8% |
| Immigrants | Micronesia | 0.3 /100 | #264 | Tragic 54.8% |
| Immigrants | Laos | 0.2 /100 | #265 | Tragic 54.7% |
| Potawatomi | 0.2 /100 | #266 | Tragic 54.6% |
| Blackfeet | 0.2 /100 | #267 | Tragic 54.6% |