Immigrants from Albania vs Immigrants from Nicaragua 6th Grade
COMPARE
Immigrants from Albania
Immigrants from Nicaragua
6th Grade
6th Grade Comparison
Immigrants from Albania
Immigrants from Nicaragua
96.9%
6TH GRADE
18.8/ 100
METRIC RATING
198th/ 347
METRIC RANK
95.1%
6TH GRADE
0.0/ 100
METRIC RATING
325th/ 347
METRIC RANK
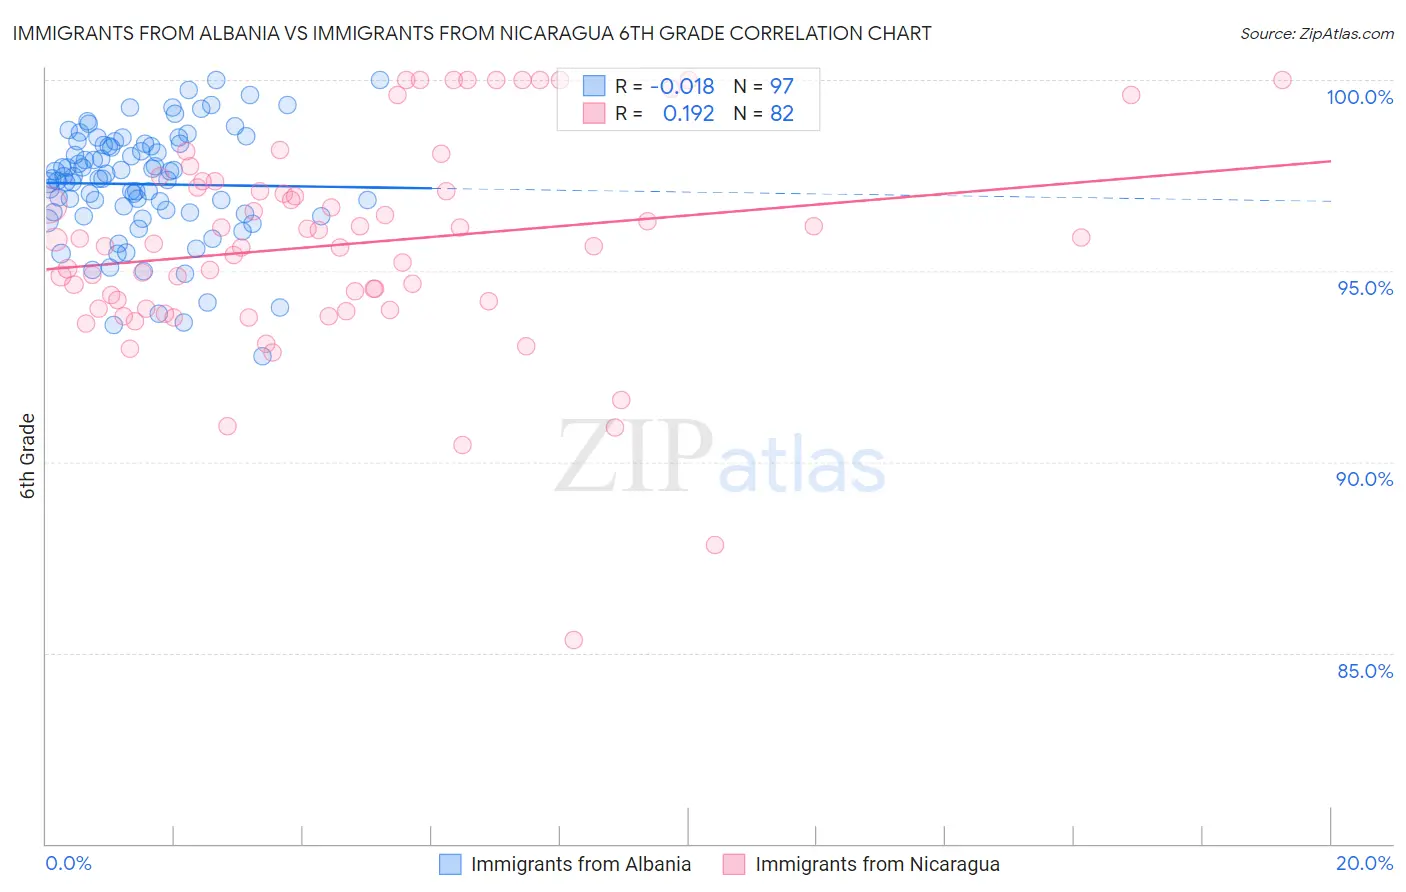
Immigrants from Albania vs Immigrants from Nicaragua 6th Grade Correlation Chart
The statistical analysis conducted on geographies consisting of 119,265,453 people shows no correlation between the proportion of Immigrants from Albania and percentage of population with at least 6th grade education in the United States with a correlation coefficient (R) of -0.018 and weighted average of 96.9%. Similarly, the statistical analysis conducted on geographies consisting of 236,341,411 people shows a poor positive correlation between the proportion of Immigrants from Nicaragua and percentage of population with at least 6th grade education in the United States with a correlation coefficient (R) of 0.192 and weighted average of 95.1%, a difference of 1.9%.
6th Grade Correlation Summary
| Measurement | Immigrants from Albania | Immigrants from Nicaragua |
| Minimum | 92.8% | 85.3% |
| Maximum | 100.0% | 100.0% |
| Range | 7.2% | 14.7% |
| Mean | 97.3% | 95.7% |
| Median | 97.4% | 95.7% |
| Interquartile 25% (IQ1) | 96.5% | 94.0% |
| Interquartile 75% (IQ3) | 98.3% | 97.2% |
| Interquartile Range (IQR) | 1.8% | 3.1% |
| Standard Deviation (Sample) | 1.5% | 2.8% |
| Standard Deviation (Population) | 1.5% | 2.8% |
Similar Demographics by 6th Grade
Demographics Similar to Immigrants from Albania by 6th Grade
In terms of 6th grade, the demographic groups most similar to Immigrants from Albania are Brazilian (96.9%, a difference of 0.010%), Immigrants from Uganda (96.9%, a difference of 0.020%), Immigrants from Northern Africa (96.9%, a difference of 0.020%), African (96.9%, a difference of 0.030%), and Immigrants from Brazil (96.9%, a difference of 0.040%).
| Demographics | Rating | Rank | 6th Grade |
| Panamanians | 27.3 /100 | #191 | Fair 96.9% |
| Hawaiians | 27.0 /100 | #192 | Fair 96.9% |
| Paraguayans | 26.6 /100 | #193 | Fair 96.9% |
| Immigrants | Lebanon | 25.6 /100 | #194 | Fair 96.9% |
| Immigrants | Brazil | 25.5 /100 | #195 | Fair 96.9% |
| Immigrants | Uganda | 21.2 /100 | #196 | Fair 96.9% |
| Brazilians | 20.1 /100 | #197 | Fair 96.9% |
| Immigrants | Albania | 18.8 /100 | #198 | Poor 96.9% |
| Immigrants | Northern Africa | 15.7 /100 | #199 | Poor 96.9% |
| Africans | 14.8 /100 | #200 | Poor 96.9% |
| Immigrants | Zaire | 14.5 /100 | #201 | Poor 96.9% |
| Immigrants | Chile | 14.2 /100 | #202 | Poor 96.8% |
| Sudanese | 13.9 /100 | #203 | Poor 96.8% |
| Immigrants | Bahamas | 13.8 /100 | #204 | Poor 96.8% |
| Natives/Alaskans | 13.0 /100 | #205 | Poor 96.8% |
Demographics Similar to Immigrants from Nicaragua by 6th Grade
In terms of 6th grade, the demographic groups most similar to Immigrants from Nicaragua are Cape Verdean (95.1%, a difference of 0.030%), Central American Indian (95.1%, a difference of 0.060%), Immigrants from Cambodia (95.2%, a difference of 0.070%), Hispanic or Latino (95.0%, a difference of 0.070%), and Mexican American Indian (95.0%, a difference of 0.10%).
| Demographics | Rating | Rank | 6th Grade |
| Belizeans | 0.0 /100 | #318 | Tragic 95.3% |
| Immigrants | Belize | 0.0 /100 | #319 | Tragic 95.3% |
| Immigrants | Ecuador | 0.0 /100 | #320 | Tragic 95.3% |
| Immigrants | Fiji | 0.0 /100 | #321 | Tragic 95.2% |
| Immigrants | Cambodia | 0.0 /100 | #322 | Tragic 95.2% |
| Central American Indians | 0.0 /100 | #323 | Tragic 95.1% |
| Cape Verdeans | 0.0 /100 | #324 | Tragic 95.1% |
| Immigrants | Nicaragua | 0.0 /100 | #325 | Tragic 95.1% |
| Hispanics or Latinos | 0.0 /100 | #326 | Tragic 95.0% |
| Mexican American Indians | 0.0 /100 | #327 | Tragic 95.0% |
| Hondurans | 0.0 /100 | #328 | Tragic 95.0% |
| Dominicans | 0.0 /100 | #329 | Tragic 94.9% |
| Nepalese | 0.0 /100 | #330 | Tragic 94.9% |
| Immigrants | Armenia | 0.0 /100 | #331 | Tragic 94.9% |
| Immigrants | Honduras | 0.0 /100 | #332 | Tragic 94.8% |