Barbadian vs Iranian 6th Grade

COMPARE

Barbadian
Race
Ancestry
AfghanAfricanAlaska NativeAlaskan AthabascanAlbanianAleutAlsatianAmericanApacheArabArapahoArgentineanArmenianAssyrian/Chaldean/SyriacAustralianAustrianBahamianBangladeshiBarbadianBasqueBelgianBelizeanBermudanBhutaneseBlackfeetBolivianBrazilianBritishBritish West IndianBulgarianBurmeseCajunCambodianCanadianCape VerdeanCarpatho RusynCelticCentral AmericanCentral American IndianCherokeeCheyenneChickasawChileanChineseChippewaChoctawColombianColvilleComancheCosta RicanCreeCreekCroatianCrowCubanCypriotCzechCzechoslovakianDanishDelawareDominicanDutchDutch West IndianEastern EuropeanEcuadorianEgyptianEnglishEstonianEthiopianEuropeanFijianFilipinoFinnishFrenchFrench American IndianFrench CanadianGermanGerman RussianGhanaianGreekGuamanian/ChamorroGuatemalanGuyaneseHaitianHmongHonduranHopiHoumaHungarianIcelanderIndian (Asian)IndonesianInupiatIraqiIrishIroquoisIsraeliItalianJamaicanJapaneseJordanianKenyanKiowaKoreanLaotianLatvianLebaneseLiberianLithuanianLumbeeLuxembourgerMacedonianMalaysianMalteseMarshalleseMenomineeMexicanMexican American IndianMongolianMoroccanNative HawaiianNavajoNepaleseNew ZealanderNicaraguanNigerianNorthern EuropeanNorwegianOkinawanOsageOttawaPaiutePakistaniPalestinianPanamanianParaguayanPennsylvania GermanPeruvianPimaPolishPortuguesePotawatomiPuebloPuerto RicanPuget Sound SalishRomanianRussianSalvadoranSamoanScandinavianScotch-IrishScottishSeminoleSenegaleseSerbianShoshoneSierra LeoneanSiouxSlavicSlovakSloveneSomaliSouth AfricanSouth AmericanSouth American IndianSoviet UnionSpaniardSpanishSpanish AmericanSpanish American IndianSri LankanSubsaharan AfricanSudaneseSwedishSwissSyrianTaiwaneseThaiTlingit-HaidaTohono O'OdhamTonganTrinidadian and TobagonianTsimshianTurkishU.S. Virgin IslanderUgandanUkrainianUruguayanUteVenezuelanVietnameseWelshWest IndianYakamaYaquiYugoslavianYumanYup'ikZimbabwean
Immigration
NonimmigrantsImmigrantsAfghanistanAfricaAlbaniaArgentinaArmeniaAsiaAustraliaAustriaBahamasBangladeshBarbadosBelarusBelgiumBelizeBoliviaBosnia and HerzegovinaBrazilBulgariaBurma/MyanmarCabo VerdeCambodiaCameroonCanadaCaribbeanCentral AmericaChileChinaColombiaCongoCosta RicaCroatiaCubaCzechoslovakiaDenmarkDominicaDominican RepublicEastern AfricaEastern AsiaEastern EuropeEcuadorEgyptEl SalvadorEnglandEritreaEthiopiaEuropeFijiFranceGermanyGhanaGreeceGrenadaGuatemalaGuyanaHaitiHondurasHong KongHungaryIndiaIndonesiaIranIraqIrelandIsraelItalyJamaicaJapanJordanKazakhstanKenyaKoreaKuwaitLaosLatin AmericaLatviaLebanonLiberiaLithuaniaMalaysiaMexicoMicronesiaMiddle AfricaMoldovaMoroccoNepalNetherlandsNicaraguaNigeriaNorth AmericaNorth MacedoniaNorthern AfricaNorthern EuropeNorwayOceaniaPakistanPanamaPeruPhilippinesPolandPortugalRomaniaRussiaSaudi ArabiaScotlandSenegalSerbiaSierra LeoneSingaporeSomaliaSouth AfricaSouth AmericaSouth Central AsiaSouth Eastern AsiaSouthern EuropeSpainSri LankaSt. Vincent and the GrenadinesSudanSwedenSwitzerlandSyriaTaiwanThailandTrinidad and TobagoTurkeyUgandaUkraineUruguayUzbekistanVenezuelaVietnamWest IndiesWestern AfricaWestern AsiaWestern EuropeYemenZaireZimbabweAzores
Iranian
Race
Ancestry
AfghanAfricanAlaska NativeAlaskan AthabascanAlbanianAleutAlsatianAmericanApacheArabArapahoArgentineanArmenianAssyrian/Chaldean/SyriacAustralianAustrianBahamianBangladeshiBasqueBelgianBelizeanBermudanBhutaneseBlackfeetBolivianBrazilianBritishBritish West IndianBulgarianBurmeseCajunCambodianCanadianCape VerdeanCarpatho RusynCelticCentral AmericanCentral American IndianCherokeeCheyenneChickasawChileanChineseChippewaChoctawColombianColvilleComancheCosta RicanCreeCreekCroatianCrowCubanCypriotCzechCzechoslovakianDanishDelawareDominicanDutchDutch West IndianEastern EuropeanEcuadorianEgyptianEnglishEstonianEthiopianEuropeanFijianFilipinoFinnishFrenchFrench American IndianFrench CanadianGermanGerman RussianGhanaianGreekGuamanian/ChamorroGuatemalanGuyaneseHaitianHmongHonduranHopiHoumaHungarianIcelanderIndian (Asian)IndonesianInupiatIranianIraqiIrishIroquoisIsraeliItalianJamaicanJapaneseJordanianKenyanKiowaKoreanLaotianLatvianLebaneseLiberianLithuanianLumbeeLuxembourgerMacedonianMalaysianMalteseMarshalleseMenomineeMexicanMexican American IndianMongolianMoroccanNative HawaiianNavajoNepaleseNew ZealanderNicaraguanNigerianNorthern EuropeanNorwegianOkinawanOsageOttawaPaiutePakistaniPalestinianPanamanianParaguayanPennsylvania GermanPeruvianPimaPolishPortuguesePotawatomiPuebloPuerto RicanPuget Sound SalishRomanianRussianSalvadoranSamoanScandinavianScotch-IrishScottishSeminoleSenegaleseSerbianShoshoneSierra LeoneanSiouxSlavicSlovakSloveneSomaliSouth AfricanSouth AmericanSouth American IndianSoviet UnionSpaniardSpanishSpanish AmericanSpanish American IndianSri LankanSubsaharan AfricanSudaneseSwedishSwissSyrianTaiwaneseThaiTlingit-HaidaTohono O'OdhamTonganTrinidadian and TobagonianTsimshianTurkishU.S. Virgin IslanderUgandanUkrainianUruguayanUteVenezuelanVietnameseWelshWest IndianYakamaYaquiYugoslavianYumanYup'ikZimbabwean
Immigration
NonimmigrantsImmigrantsAfghanistanAfricaAlbaniaArgentinaArmeniaAsiaAustraliaAustriaBahamasBangladeshBarbadosBelarusBelgiumBelizeBoliviaBosnia and HerzegovinaBrazilBulgariaBurma/MyanmarCabo VerdeCambodiaCameroonCanadaCaribbeanCentral AmericaChileChinaColombiaCongoCosta RicaCroatiaCubaCzechoslovakiaDenmarkDominicaDominican RepublicEastern AfricaEastern AsiaEastern EuropeEcuadorEgyptEl SalvadorEnglandEritreaEthiopiaEuropeFijiFranceGermanyGhanaGreeceGrenadaGuatemalaGuyanaHaitiHondurasHong KongHungaryIndiaIndonesiaIranIraqIrelandIsraelItalyJamaicaJapanJordanKazakhstanKenyaKoreaKuwaitLaosLatin AmericaLatviaLebanonLiberiaLithuaniaMalaysiaMexicoMicronesiaMiddle AfricaMoldovaMoroccoNepalNetherlandsNicaraguaNigeriaNorth AmericaNorth MacedoniaNorthern AfricaNorthern EuropeNorwayOceaniaPakistanPanamaPeruPhilippinesPolandPortugalRomaniaRussiaSaudi ArabiaScotlandSenegalSerbiaSierra LeoneSingaporeSomaliaSouth AfricaSouth AmericaSouth Central AsiaSouth Eastern AsiaSouthern EuropeSpainSri LankaSt. Vincent and the GrenadinesSudanSwedenSwitzerlandSyriaTaiwanThailandTrinidad and TobagoTurkeyUgandaUkraineUruguayUzbekistanVenezuelaVietnamWest IndiesWestern AfricaWestern AsiaWestern EuropeYemenZaireZimbabweAzores
6th Grade
Income
Poverty
Unemployment
Labor Participation
Family Structure
Vehicle Availability
Education Level
Disability

6th Grade Comparison

Barbadians

Iranians

Tragic
Exceptional
96.2%
6TH GRADE
0.0/ 100
METRIC RATING
286th/ 347
METRIC RANK
97.6%
6TH GRADE
99.6/ 100
METRIC RATING
69th/ 347
METRIC RANK

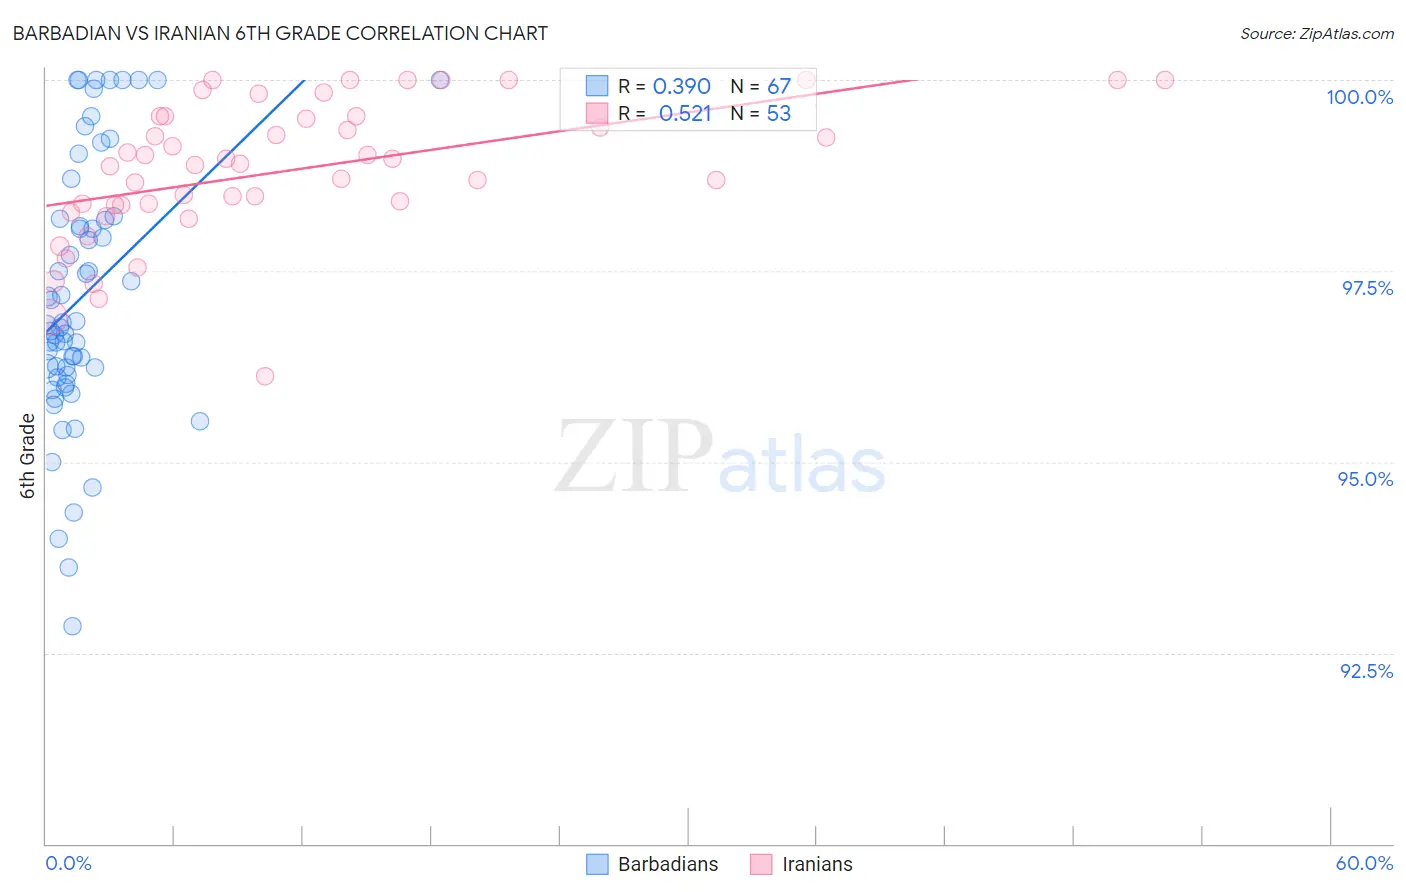
Barbadian vs Iranian 6th Grade Correlation Chart

The statistical analysis conducted on geographies consisting of 141,304,590 people shows a mild positive correlation between the proportion of Barbadians and percentage of population with at least 6th grade education in the United States with a correlation coefficient (R) of 0.390 and weighted average of 96.2%. Similarly, the statistical analysis conducted on geographies consisting of 310,636,461 people shows a substantial positive correlation between the proportion of Iranians and percentage of population with at least 6th grade education in the United States with a correlation coefficient (R) of 0.521 and weighted average of 97.6%, a difference of 1.5%.
Barbadian vs Iranian 6th Grade

6th Grade Correlation Summary

MeasurementBarbadianIranian
Minimum92.8%96.1%
Maximum100.0%100.0%
Range7.2%3.9%
Mean97.2%98.8%
Median96.8%98.9%
Interquartile 25% (IQ1)96.1%98.4%
Interquartile 75% (IQ3)98.2%99.5%
Interquartile Range (IQR)2.0%1.2%
Standard Deviation (Sample)1.7%0.91%
Standard Deviation (Population)1.7%0.90%

Similar Demographics by 6th Grade

Demographics Similar to Barbadians by 6th Grade

In terms of 6th grade, the demographic groups most similar to Barbadians are Immigrants from Trinidad and Tobago (96.2%, a difference of 0.010%), Malaysian (96.2%, a difference of 0.020%), Somali (96.2%, a difference of 0.030%), Fijian (96.2%, a difference of 0.040%), and Immigrants from Eritrea (96.1%, a difference of 0.040%).
DemographicsRating | Rank6th Grade
Immigrants | Peru
0.1
/100
|
#279
Tragic
96.2%
Immigrants | Afghanistan
0.1
/100
|
#280
Tragic
96.2%
Trinidadians and Tobagonians
0.1
/100
|
#281
Tragic
96.2%
Houma
0.1
/100
|
#282
Tragic
96.2%
Cubans
0.1
/100
|
#283
Tragic
96.2%
Fijians
0.1
/100
|
#284
Tragic
96.2%
Somalis
0.1
/100
|
#285
Tragic
96.2%
Barbadians
0.0
/100
|
#286
Tragic
96.2%
Immigrants | Trinidad and Tobago
0.0
/100
|
#287
Tragic
96.2%
Malaysians
0.0
/100
|
#288
Tragic
96.2%
Immigrants | Eritrea
0.0
/100
|
#289
Tragic
96.1%
Immigrants | Somalia
0.0
/100
|
#290
Tragic
96.1%
Immigrants | St. Vincent and the Grenadines
0.0
/100
|
#291
Tragic
96.1%
Immigrants | Barbados
0.0
/100
|
#292
Tragic
96.1%
Immigrants | West Indies
0.0
/100
|
#293
Tragic
96.1%

Demographics Similar to Iranians by 6th Grade

In terms of 6th grade, the demographic groups most similar to Iranians are Cajun (97.6%, a difference of 0.010%), New Zealander (97.7%, a difference of 0.020%), Kiowa (97.7%, a difference of 0.020%), Immigrants from Austria (97.7%, a difference of 0.020%), and Chickasaw (97.6%, a difference of 0.020%).
DemographicsRating | Rank6th Grade
Immigrants | North America
99.7
/100
|
#62
Exceptional
97.7%
Russians
99.7
/100
|
#63
Exceptional
97.7%
Canadians
99.7
/100
|
#64
Exceptional
97.7%
Immigrants | Northern Europe
99.6
/100
|
#65
Exceptional
97.7%
New Zealanders
99.6
/100
|
#66
Exceptional
97.7%
Kiowa
99.6
/100
|
#67
Exceptional
97.7%
Immigrants | Austria
99.6
/100
|
#68
Exceptional
97.7%
Iranians
99.6
/100
|
#69
Exceptional
97.6%
Cajuns
99.5
/100
|
#70
Exceptional
97.6%
Chickasaw
99.5
/100
|
#71
Exceptional
97.6%
Macedonians
99.4
/100
|
#72
Exceptional
97.6%
Cherokee
99.4
/100
|
#73
Exceptional
97.6%
Immigrants | Netherlands
99.4
/100
|
#74
Exceptional
97.6%
Ukrainians
99.4
/100
|
#75
Exceptional
97.6%
Immigrants | England
99.4
/100
|
#76
Exceptional
97.6%