Bangladeshi vs Filipino Doctorate Degree
COMPARE
Bangladeshi
Filipino
Doctorate Degree
Doctorate Degree Comparison
Bangladeshis
Filipinos
1.2%
DOCTORATE DEGREE
0.0/ 100
METRIC RATING
337th/ 347
METRIC RANK
3.4%
DOCTORATE DEGREE
100.0/ 100
METRIC RATING
2nd/ 347
METRIC RANK
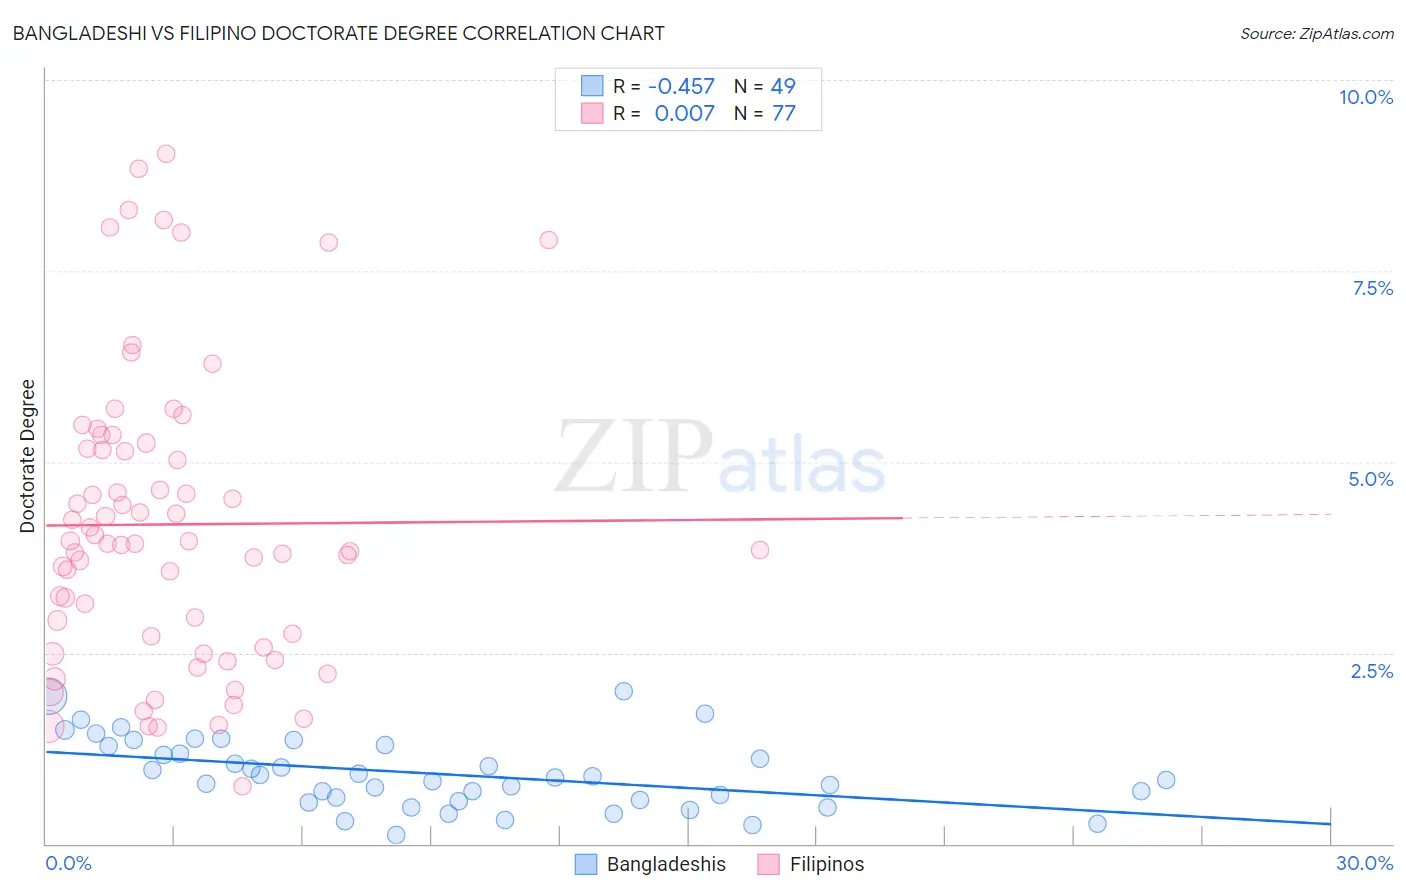
Bangladeshi vs Filipino Doctorate Degree Correlation Chart
The statistical analysis conducted on geographies consisting of 140,269,397 people shows a moderate negative correlation between the proportion of Bangladeshis and percentage of population with at least doctorate degree education in the United States with a correlation coefficient (R) of -0.457 and weighted average of 1.2%. Similarly, the statistical analysis conducted on geographies consisting of 253,646,775 people shows no correlation between the proportion of Filipinos and percentage of population with at least doctorate degree education in the United States with a correlation coefficient (R) of 0.007 and weighted average of 3.4%, a difference of 183.7%.
Doctorate Degree Correlation Summary
| Measurement | Bangladeshi | Filipino |
| Minimum | 0.12% | 0.76% |
| Maximum | 2.0% | 9.0% |
| Range | 1.9% | 8.3% |
| Mean | 0.92% | 4.2% |
| Median | 0.87% | 3.9% |
| Interquartile 25% (IQ1) | 0.56% | 2.6% |
| Interquartile 75% (IQ3) | 1.3% | 5.2% |
| Interquartile Range (IQR) | 0.72% | 2.6% |
| Standard Deviation (Sample) | 0.45% | 1.9% |
| Standard Deviation (Population) | 0.45% | 1.9% |
Similar Demographics by Doctorate Degree
Demographics Similar to Bangladeshis by Doctorate Degree
In terms of doctorate degree, the demographic groups most similar to Bangladeshis are Puget Sound Salish (1.2%, a difference of 0.75%), Immigrants from Central America (1.2%, a difference of 2.1%), Immigrants from Cuba (1.2%, a difference of 2.9%), Mexican (1.2%, a difference of 3.4%), and Nepalese (1.3%, a difference of 3.5%).
| Demographics | Rating | Rank | Doctorate Degree |
| Yup'ik | 0.0 /100 | #330 | Tragic 1.3% |
| Immigrants | Latin America | 0.0 /100 | #331 | Tragic 1.3% |
| Yakama | 0.0 /100 | #332 | Tragic 1.3% |
| Immigrants | Caribbean | 0.0 /100 | #333 | Tragic 1.3% |
| Immigrants | Dominican Republic | 0.0 /100 | #334 | Tragic 1.3% |
| Immigrants | Haiti | 0.0 /100 | #335 | Tragic 1.3% |
| Nepalese | 0.0 /100 | #336 | Tragic 1.3% |
| Bangladeshis | 0.0 /100 | #337 | Tragic 1.2% |
| Puget Sound Salish | 0.0 /100 | #338 | Tragic 1.2% |
| Immigrants | Central America | 0.0 /100 | #339 | Tragic 1.2% |
| Immigrants | Cuba | 0.0 /100 | #340 | Tragic 1.2% |
| Mexicans | 0.0 /100 | #341 | Tragic 1.2% |
| Arapaho | 0.0 /100 | #342 | Tragic 1.2% |
| Fijians | 0.0 /100 | #343 | Tragic 1.1% |
| Immigrants | Mexico | 0.0 /100 | #344 | Tragic 1.1% |
Demographics Similar to Filipinos by Doctorate Degree
In terms of doctorate degree, the demographic groups most similar to Filipinos are Okinawan (3.3%, a difference of 4.7%), Immigrants from Singapore (3.7%, a difference of 7.2%), Immigrants from Taiwan (3.2%, a difference of 7.4%), Iranian (3.1%, a difference of 9.1%), and Immigrants from Switzerland (3.1%, a difference of 11.2%).
| Demographics | Rating | Rank | Doctorate Degree |
| Immigrants | Singapore | 100.0 /100 | #1 | Exceptional 3.7% |
| Filipinos | 100.0 /100 | #2 | Exceptional 3.4% |
| Okinawans | 100.0 /100 | #3 | Exceptional 3.3% |
| Immigrants | Taiwan | 100.0 /100 | #4 | Exceptional 3.2% |
| Iranians | 100.0 /100 | #5 | Exceptional 3.1% |
| Immigrants | Switzerland | 100.0 /100 | #6 | Exceptional 3.1% |
| Immigrants | China | 100.0 /100 | #7 | Exceptional 3.1% |
| Immigrants | Israel | 100.0 /100 | #8 | Exceptional 3.0% |
| Immigrants | Iran | 100.0 /100 | #9 | Exceptional 3.0% |
| Immigrants | Eastern Asia | 100.0 /100 | #10 | Exceptional 3.0% |
| Indians (Asian) | 100.0 /100 | #11 | Exceptional 2.9% |
| Immigrants | Belgium | 100.0 /100 | #12 | Exceptional 2.9% |
| Immigrants | Sweden | 100.0 /100 | #13 | Exceptional 2.9% |
| Immigrants | France | 100.0 /100 | #14 | Exceptional 2.9% |
| Immigrants | India | 100.0 /100 | #15 | Exceptional 2.8% |