Delaware vs Filipino Doctorate Degree
COMPARE
Delaware
Filipino
Doctorate Degree
Doctorate Degree Comparison
Delaware
Filipinos
1.6%
DOCTORATE DEGREE
1.9/ 100
METRIC RATING
245th/ 347
METRIC RANK
3.4%
DOCTORATE DEGREE
100.0/ 100
METRIC RATING
2nd/ 347
METRIC RANK
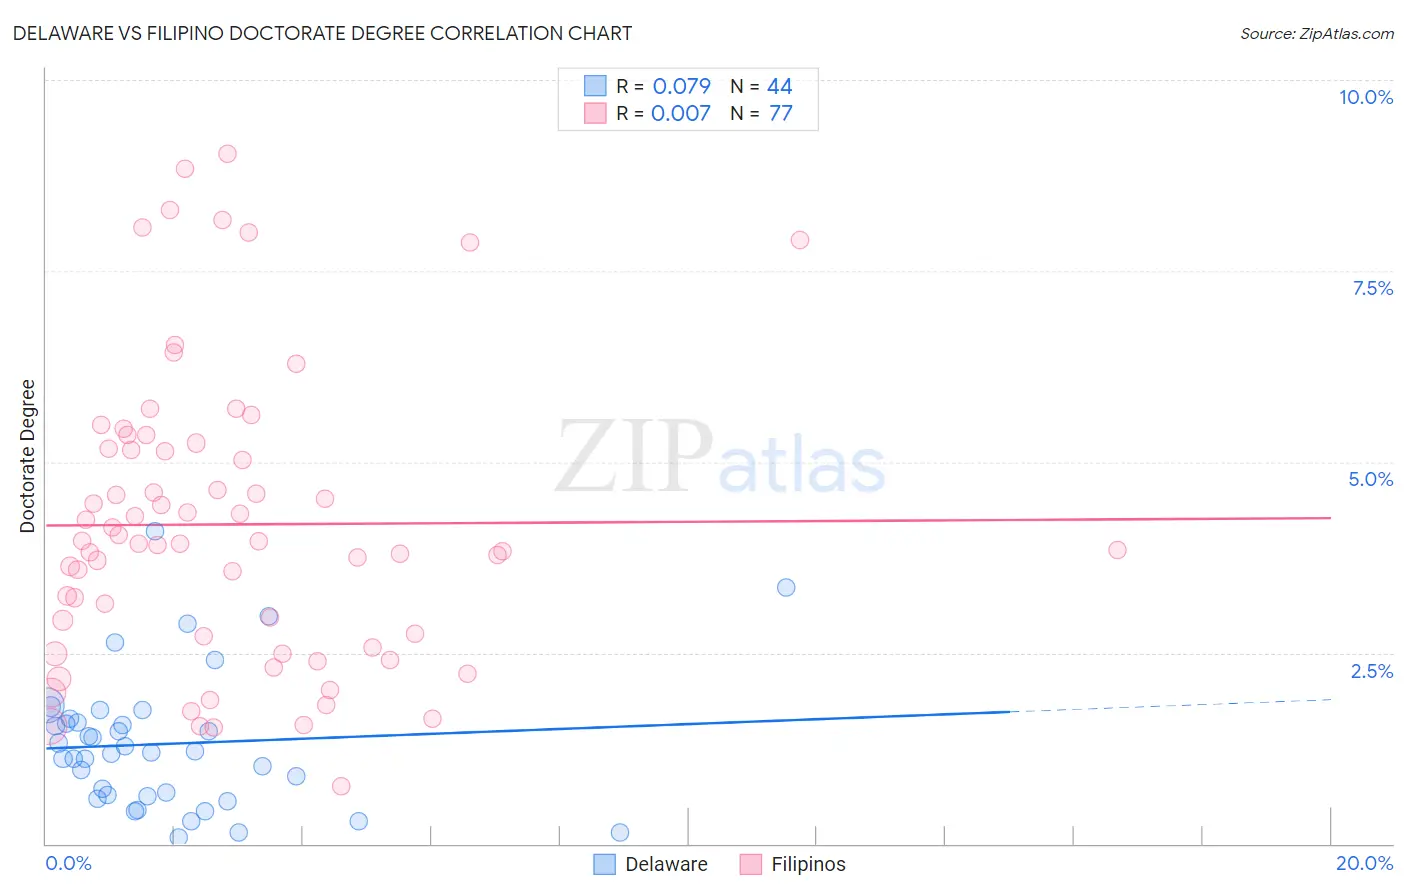
Delaware vs Filipino Doctorate Degree Correlation Chart
The statistical analysis conducted on geographies consisting of 95,720,463 people shows a slight positive correlation between the proportion of Delaware and percentage of population with at least doctorate degree education in the United States with a correlation coefficient (R) of 0.079 and weighted average of 1.6%. Similarly, the statistical analysis conducted on geographies consisting of 253,646,775 people shows no correlation between the proportion of Filipinos and percentage of population with at least doctorate degree education in the United States with a correlation coefficient (R) of 0.007 and weighted average of 3.4%, a difference of 118.5%.
Doctorate Degree Correlation Summary
| Measurement | Delaware | Filipino |
| Minimum | 0.089% | 0.76% |
| Maximum | 4.1% | 9.0% |
| Range | 4.0% | 8.3% |
| Mean | 1.3% | 4.2% |
| Median | 1.2% | 3.9% |
| Interquartile 25% (IQ1) | 0.63% | 2.6% |
| Interquartile 75% (IQ3) | 1.6% | 5.2% |
| Interquartile Range (IQR) | 0.98% | 2.6% |
| Standard Deviation (Sample) | 0.88% | 1.9% |
| Standard Deviation (Population) | 0.87% | 1.9% |
Similar Demographics by Doctorate Degree
Demographics Similar to Delaware by Doctorate Degree
In terms of doctorate degree, the demographic groups most similar to Delaware are Hmong (1.6%, a difference of 0.10%), Comanche (1.6%, a difference of 0.12%), African (1.6%, a difference of 0.23%), French American Indian (1.6%, a difference of 0.38%), and Native Hawaiian (1.6%, a difference of 0.57%).
| Demographics | Rating | Rank | Doctorate Degree |
| Immigrants | Congo | 2.6 /100 | #238 | Tragic 1.6% |
| West Indians | 2.5 /100 | #239 | Tragic 1.6% |
| Immigrants | Panama | 2.4 /100 | #240 | Tragic 1.6% |
| Cheyenne | 2.3 /100 | #241 | Tragic 1.6% |
| Ottawa | 2.2 /100 | #242 | Tragic 1.6% |
| Native Hawaiians | 2.1 /100 | #243 | Tragic 1.6% |
| French American Indians | 2.0 /100 | #244 | Tragic 1.6% |
| Delaware | 1.9 /100 | #245 | Tragic 1.6% |
| Hmong | 1.8 /100 | #246 | Tragic 1.6% |
| Comanche | 1.8 /100 | #247 | Tragic 1.6% |
| Africans | 1.8 /100 | #248 | Tragic 1.6% |
| Potawatomi | 1.6 /100 | #249 | Tragic 1.6% |
| Immigrants | Fiji | 1.6 /100 | #250 | Tragic 1.6% |
| Apache | 1.3 /100 | #251 | Tragic 1.5% |
| Yuman | 1.1 /100 | #252 | Tragic 1.5% |
Demographics Similar to Filipinos by Doctorate Degree
In terms of doctorate degree, the demographic groups most similar to Filipinos are Okinawan (3.3%, a difference of 4.7%), Immigrants from Singapore (3.7%, a difference of 7.2%), Immigrants from Taiwan (3.2%, a difference of 7.4%), Iranian (3.1%, a difference of 9.1%), and Immigrants from Switzerland (3.1%, a difference of 11.2%).
| Demographics | Rating | Rank | Doctorate Degree |
| Immigrants | Singapore | 100.0 /100 | #1 | Exceptional 3.7% |
| Filipinos | 100.0 /100 | #2 | Exceptional 3.4% |
| Okinawans | 100.0 /100 | #3 | Exceptional 3.3% |
| Immigrants | Taiwan | 100.0 /100 | #4 | Exceptional 3.2% |
| Iranians | 100.0 /100 | #5 | Exceptional 3.1% |
| Immigrants | Switzerland | 100.0 /100 | #6 | Exceptional 3.1% |
| Immigrants | China | 100.0 /100 | #7 | Exceptional 3.1% |
| Immigrants | Israel | 100.0 /100 | #8 | Exceptional 3.0% |
| Immigrants | Iran | 100.0 /100 | #9 | Exceptional 3.0% |
| Immigrants | Eastern Asia | 100.0 /100 | #10 | Exceptional 3.0% |
| Indians (Asian) | 100.0 /100 | #11 | Exceptional 2.9% |
| Immigrants | Belgium | 100.0 /100 | #12 | Exceptional 2.9% |
| Immigrants | Sweden | 100.0 /100 | #13 | Exceptional 2.9% |
| Immigrants | France | 100.0 /100 | #14 | Exceptional 2.9% |
| Immigrants | India | 100.0 /100 | #15 | Exceptional 2.8% |