Bangladeshi vs Filipino 11th Grade
COMPARE
Bangladeshi
Filipino
11th Grade
11th Grade Comparison
Bangladeshis
Filipinos
90.9%
11TH GRADE
0.1/ 100
METRIC RATING
276th/ 347
METRIC RANK
94.1%
11TH GRADE
99.9/ 100
METRIC RATING
47th/ 347
METRIC RANK
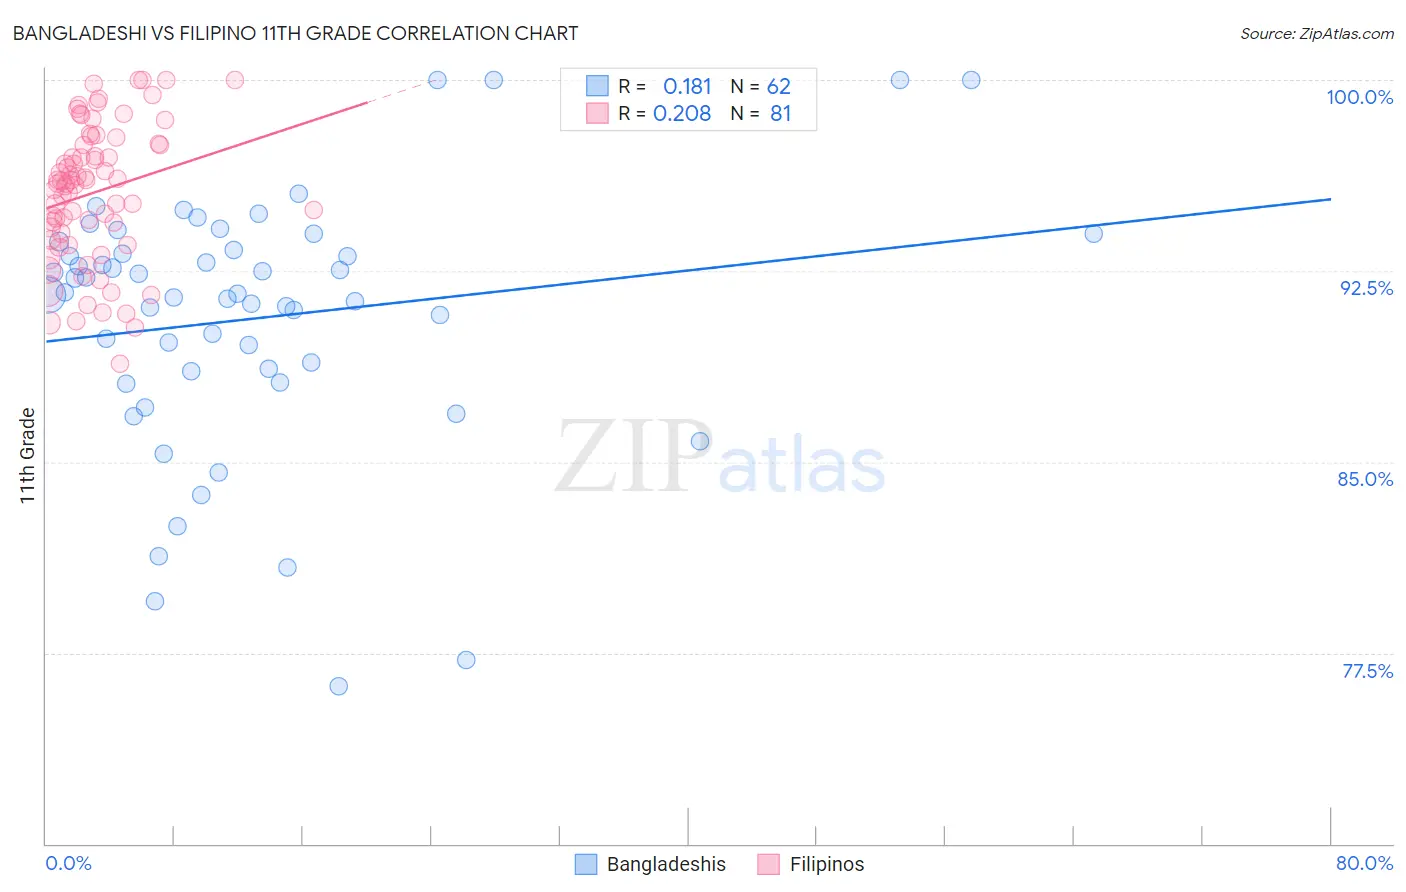
Bangladeshi vs Filipino 11th Grade Correlation Chart
The statistical analysis conducted on geographies consisting of 141,450,108 people shows a poor positive correlation between the proportion of Bangladeshis and percentage of population with at least 11th grade education in the United States with a correlation coefficient (R) of 0.181 and weighted average of 90.9%. Similarly, the statistical analysis conducted on geographies consisting of 254,351,912 people shows a weak positive correlation between the proportion of Filipinos and percentage of population with at least 11th grade education in the United States with a correlation coefficient (R) of 0.208 and weighted average of 94.1%, a difference of 3.5%.
11th Grade Correlation Summary
| Measurement | Bangladeshi | Filipino |
| Minimum | 76.2% | 88.9% |
| Maximum | 100.0% | 100.0% |
| Range | 23.8% | 11.1% |
| Mean | 90.6% | 95.6% |
| Median | 91.6% | 95.9% |
| Interquartile 25% (IQ1) | 88.5% | 93.8% |
| Interquartile 75% (IQ3) | 93.3% | 97.5% |
| Interquartile Range (IQR) | 4.8% | 3.6% |
| Standard Deviation (Sample) | 5.0% | 2.7% |
| Standard Deviation (Population) | 5.0% | 2.7% |
Similar Demographics by 11th Grade
Demographics Similar to Bangladeshis by 11th Grade
In terms of 11th grade, the demographic groups most similar to Bangladeshis are Immigrants from Congo (90.9%, a difference of 0.020%), Malaysian (90.8%, a difference of 0.050%), Immigrants from South Eastern Asia (90.9%, a difference of 0.070%), Immigrants from Trinidad and Tobago (90.9%, a difference of 0.080%), and Barbadian (90.8%, a difference of 0.10%).
| Demographics | Rating | Rank | 11th Grade |
| Ute | 0.2 /100 | #269 | Tragic 91.1% |
| Trinidadians and Tobagonians | 0.2 /100 | #270 | Tragic 91.1% |
| Immigrants | Peru | 0.1 /100 | #271 | Tragic 91.0% |
| West Indians | 0.1 /100 | #272 | Tragic 91.0% |
| Paiute | 0.1 /100 | #273 | Tragic 91.0% |
| Immigrants | Trinidad and Tobago | 0.1 /100 | #274 | Tragic 90.9% |
| Immigrants | South Eastern Asia | 0.1 /100 | #275 | Tragic 90.9% |
| Bangladeshis | 0.1 /100 | #276 | Tragic 90.9% |
| Immigrants | Congo | 0.1 /100 | #277 | Tragic 90.9% |
| Malaysians | 0.1 /100 | #278 | Tragic 90.8% |
| Barbadians | 0.0 /100 | #279 | Tragic 90.8% |
| Sri Lankans | 0.0 /100 | #280 | Tragic 90.7% |
| Dutch West Indians | 0.0 /100 | #281 | Tragic 90.7% |
| Immigrants | St. Vincent and the Grenadines | 0.0 /100 | #282 | Tragic 90.7% |
| Immigrants | Barbados | 0.0 /100 | #283 | Tragic 90.7% |
Demographics Similar to Filipinos by 11th Grade
In terms of 11th grade, the demographic groups most similar to Filipinos are Macedonian (94.1%, a difference of 0.0%), Slavic (94.1%, a difference of 0.0%), Serbian (94.1%, a difference of 0.010%), French (94.1%, a difference of 0.010%), and Australian (94.1%, a difference of 0.020%).
| Demographics | Rating | Rank | 11th Grade |
| Thais | 99.9 /100 | #40 | Exceptional 94.1% |
| Cypriots | 99.9 /100 | #41 | Exceptional 94.1% |
| Immigrants | Austria | 99.9 /100 | #42 | Exceptional 94.1% |
| Greeks | 99.9 /100 | #43 | Exceptional 94.1% |
| Immigrants | Ireland | 99.9 /100 | #44 | Exceptional 94.1% |
| Australians | 99.9 /100 | #45 | Exceptional 94.1% |
| Serbians | 99.9 /100 | #46 | Exceptional 94.1% |
| Filipinos | 99.9 /100 | #47 | Exceptional 94.1% |
| Macedonians | 99.9 /100 | #48 | Exceptional 94.1% |
| Slavs | 99.9 /100 | #49 | Exceptional 94.1% |
| French | 99.9 /100 | #50 | Exceptional 94.1% |
| Turks | 99.9 /100 | #51 | Exceptional 94.0% |
| Immigrants | Canada | 99.9 /100 | #52 | Exceptional 94.0% |
| Immigrants | Australia | 99.9 /100 | #53 | Exceptional 94.0% |
| Immigrants | North America | 99.9 /100 | #54 | Exceptional 94.0% |