Cape Verdean vs Filipino Doctorate Degree
COMPARE
Cape Verdean
Filipino
Doctorate Degree
Doctorate Degree Comparison
Cape Verdeans
Filipinos
1.4%
DOCTORATE DEGREE
0.3/ 100
METRIC RATING
289th/ 347
METRIC RANK
3.4%
DOCTORATE DEGREE
100.0/ 100
METRIC RATING
2nd/ 347
METRIC RANK
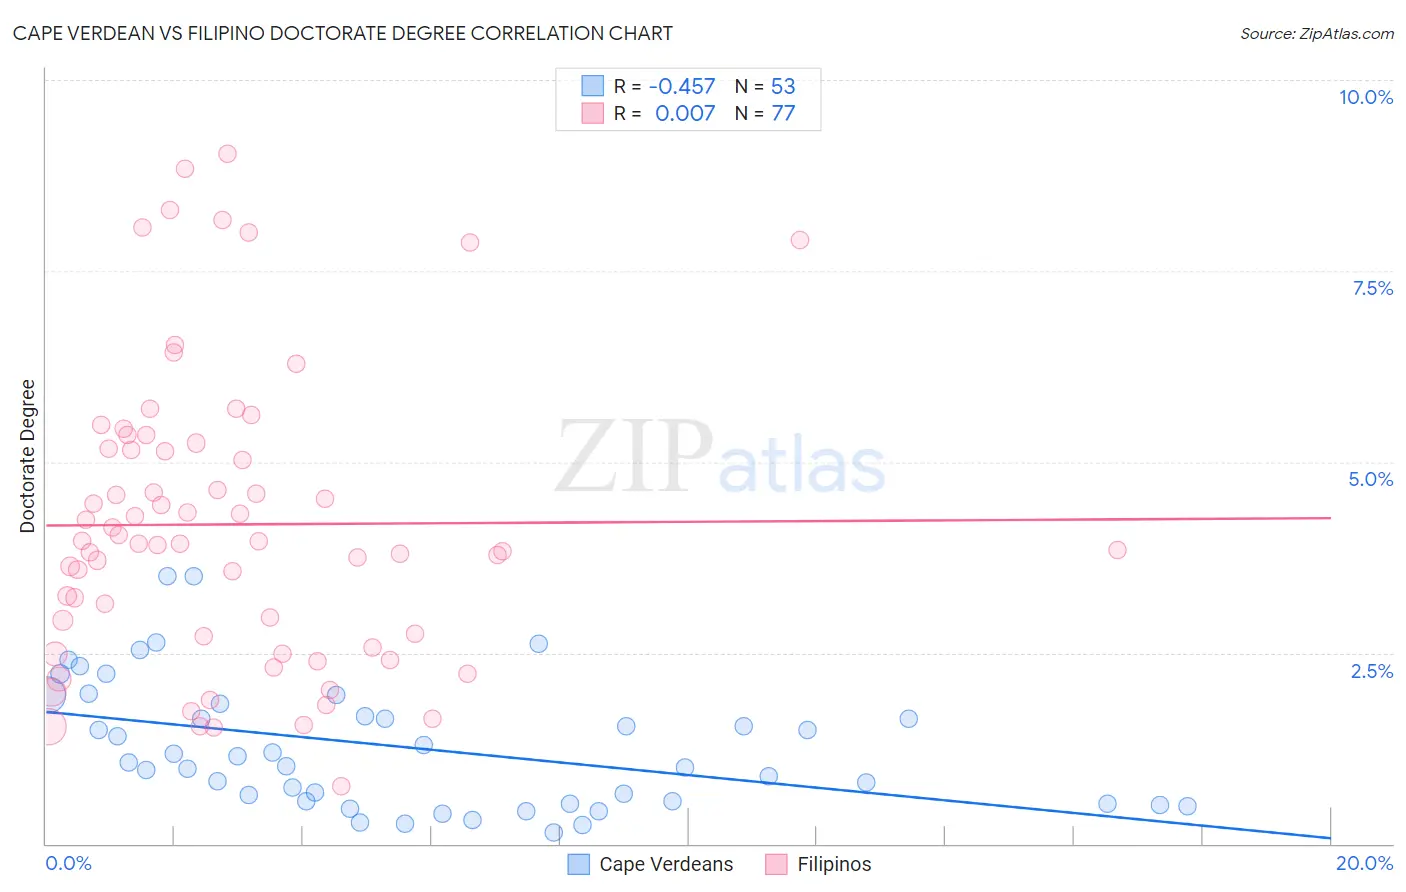
Cape Verdean vs Filipino Doctorate Degree Correlation Chart
The statistical analysis conducted on geographies consisting of 107,405,258 people shows a moderate negative correlation between the proportion of Cape Verdeans and percentage of population with at least doctorate degree education in the United States with a correlation coefficient (R) of -0.457 and weighted average of 1.4%. Similarly, the statistical analysis conducted on geographies consisting of 253,646,775 people shows no correlation between the proportion of Filipinos and percentage of population with at least doctorate degree education in the United States with a correlation coefficient (R) of 0.007 and weighted average of 3.4%, a difference of 137.5%.
Doctorate Degree Correlation Summary
| Measurement | Cape Verdean | Filipino |
| Minimum | 0.14% | 0.76% |
| Maximum | 3.5% | 9.0% |
| Range | 3.4% | 8.3% |
| Mean | 1.3% | 4.2% |
| Median | 1.1% | 3.9% |
| Interquartile 25% (IQ1) | 0.54% | 2.6% |
| Interquartile 75% (IQ3) | 1.7% | 5.2% |
| Interquartile Range (IQR) | 1.2% | 2.6% |
| Standard Deviation (Sample) | 0.83% | 1.9% |
| Standard Deviation (Population) | 0.82% | 1.9% |
Similar Demographics by Doctorate Degree
Demographics Similar to Cape Verdeans by Doctorate Degree
In terms of doctorate degree, the demographic groups most similar to Cape Verdeans are Choctaw (1.4%, a difference of 0.020%), Immigrants from El Salvador (1.4%, a difference of 0.14%), Black/African American (1.4%, a difference of 0.24%), Cajun (1.5%, a difference of 0.31%), and Alaska Native (1.4%, a difference of 0.42%).
| Demographics | Rating | Rank | Doctorate Degree |
| British West Indians | 0.3 /100 | #282 | Tragic 1.5% |
| Central Americans | 0.3 /100 | #283 | Tragic 1.5% |
| Jamaicans | 0.3 /100 | #284 | Tragic 1.5% |
| Malaysians | 0.3 /100 | #285 | Tragic 1.5% |
| Cherokee | 0.3 /100 | #286 | Tragic 1.5% |
| Cajuns | 0.3 /100 | #287 | Tragic 1.5% |
| Immigrants | El Salvador | 0.3 /100 | #288 | Tragic 1.4% |
| Cape Verdeans | 0.3 /100 | #289 | Tragic 1.4% |
| Choctaw | 0.3 /100 | #290 | Tragic 1.4% |
| Blacks/African Americans | 0.3 /100 | #291 | Tragic 1.4% |
| Alaska Natives | 0.3 /100 | #292 | Tragic 1.4% |
| Immigrants | Yemen | 0.2 /100 | #293 | Tragic 1.4% |
| Samoans | 0.2 /100 | #294 | Tragic 1.4% |
| Guatemalans | 0.2 /100 | #295 | Tragic 1.4% |
| Immigrants | Ecuador | 0.2 /100 | #296 | Tragic 1.4% |
Demographics Similar to Filipinos by Doctorate Degree
In terms of doctorate degree, the demographic groups most similar to Filipinos are Okinawan (3.3%, a difference of 4.7%), Immigrants from Singapore (3.7%, a difference of 7.2%), Immigrants from Taiwan (3.2%, a difference of 7.4%), Iranian (3.1%, a difference of 9.1%), and Immigrants from Switzerland (3.1%, a difference of 11.2%).
| Demographics | Rating | Rank | Doctorate Degree |
| Immigrants | Singapore | 100.0 /100 | #1 | Exceptional 3.7% |
| Filipinos | 100.0 /100 | #2 | Exceptional 3.4% |
| Okinawans | 100.0 /100 | #3 | Exceptional 3.3% |
| Immigrants | Taiwan | 100.0 /100 | #4 | Exceptional 3.2% |
| Iranians | 100.0 /100 | #5 | Exceptional 3.1% |
| Immigrants | Switzerland | 100.0 /100 | #6 | Exceptional 3.1% |
| Immigrants | China | 100.0 /100 | #7 | Exceptional 3.1% |
| Immigrants | Israel | 100.0 /100 | #8 | Exceptional 3.0% |
| Immigrants | Iran | 100.0 /100 | #9 | Exceptional 3.0% |
| Immigrants | Eastern Asia | 100.0 /100 | #10 | Exceptional 3.0% |
| Indians (Asian) | 100.0 /100 | #11 | Exceptional 2.9% |
| Immigrants | Belgium | 100.0 /100 | #12 | Exceptional 2.9% |
| Immigrants | Sweden | 100.0 /100 | #13 | Exceptional 2.9% |
| Immigrants | France | 100.0 /100 | #14 | Exceptional 2.9% |
| Immigrants | India | 100.0 /100 | #15 | Exceptional 2.8% |