Bangladeshi vs Immigrants from Italy Doctorate Degree

COMPARE

Bangladeshi
Race
Ancestry
AfghanAfricanAlaska NativeAlaskan AthabascanAlbanianAleutAlsatianAmericanApacheArabArapahoArgentineanArmenianAssyrian/Chaldean/SyriacAustralianAustrianBahamianBangladeshiBarbadianBasqueBelgianBelizeanBermudanBhutaneseBlackfeetBolivianBrazilianBritishBritish West IndianBulgarianBurmeseCajunCambodianCanadianCape VerdeanCarpatho RusynCelticCentral AmericanCentral American IndianCherokeeCheyenneChickasawChileanChineseChippewaChoctawColombianColvilleComancheCosta RicanCreeCreekCroatianCrowCubanCypriotCzechCzechoslovakianDanishDelawareDominicanDutchDutch West IndianEastern EuropeanEcuadorianEgyptianEnglishEstonianEthiopianEuropeanFijianFilipinoFinnishFrenchFrench American IndianFrench CanadianGermanGerman RussianGhanaianGreekGuamanian/ChamorroGuatemalanGuyaneseHaitianHmongHonduranHopiHoumaHungarianIcelanderIndian (Asian)IndonesianInupiatIranianIraqiIrishIroquoisIsraeliItalianJamaicanJapaneseJordanianKenyanKiowaKoreanLaotianLatvianLebaneseLiberianLithuanianLumbeeLuxembourgerMacedonianMalaysianMalteseMarshalleseMenomineeMexicanMexican American IndianMongolianMoroccanNative HawaiianNavajoNepaleseNew ZealanderNicaraguanNigerianNorthern EuropeanNorwegianOkinawanOsageOttawaPaiutePakistaniPalestinianPanamanianParaguayanPennsylvania GermanPeruvianPimaPolishPortuguesePotawatomiPuebloPuerto RicanPuget Sound SalishRomanianRussianSalvadoranSamoanScandinavianScotch-IrishScottishSeminoleSenegaleseSerbianShoshoneSierra LeoneanSiouxSlavicSlovakSloveneSomaliSouth AfricanSouth AmericanSouth American IndianSoviet UnionSpaniardSpanishSpanish AmericanSpanish American IndianSri LankanSubsaharan AfricanSudaneseSwedishSwissSyrianTaiwaneseThaiTlingit-HaidaTohono O'OdhamTonganTrinidadian and TobagonianTsimshianTurkishU.S. Virgin IslanderUgandanUkrainianUruguayanUteVenezuelanVietnameseWelshWest IndianYakamaYaquiYugoslavianYumanYup'ikZimbabwean
Immigration
NonimmigrantsImmigrantsAfghanistanAfricaAlbaniaArgentinaArmeniaAsiaAustraliaAustriaBahamasBangladeshBarbadosBelarusBelgiumBelizeBoliviaBosnia and HerzegovinaBrazilBulgariaBurma/MyanmarCabo VerdeCambodiaCameroonCanadaCaribbeanCentral AmericaChileChinaColombiaCongoCosta RicaCroatiaCubaCzechoslovakiaDenmarkDominicaDominican RepublicEastern AfricaEastern AsiaEastern EuropeEcuadorEgyptEl SalvadorEnglandEritreaEthiopiaEuropeFijiFranceGermanyGhanaGreeceGrenadaGuatemalaGuyanaHaitiHondurasHong KongHungaryIndiaIndonesiaIranIraqIrelandIsraelJamaicaJapanJordanKazakhstanKenyaKoreaKuwaitLaosLatin AmericaLatviaLebanonLiberiaLithuaniaMalaysiaMexicoMicronesiaMiddle AfricaMoldovaMoroccoNepalNetherlandsNicaraguaNigeriaNorth AmericaNorth MacedoniaNorthern AfricaNorthern EuropeNorwayOceaniaPakistanPanamaPeruPhilippinesPolandPortugalRomaniaRussiaSaudi ArabiaScotlandSenegalSerbiaSierra LeoneSingaporeSomaliaSouth AfricaSouth AmericaSouth Central AsiaSouth Eastern AsiaSouthern EuropeSpainSri LankaSt. Vincent and the GrenadinesSudanSwedenSwitzerlandSyriaTaiwanThailandTrinidad and TobagoTurkeyUgandaUkraineUruguayUzbekistanVenezuelaVietnamWest IndiesWestern AfricaWestern AsiaWestern EuropeYemenZaireZimbabweAzores
Immigrants from Italy
Race
Ancestry
AfghanAfricanAlaska NativeAlaskan AthabascanAlbanianAleutAlsatianAmericanApacheArabArapahoArgentineanArmenianAssyrian/Chaldean/SyriacAustralianAustrianBahamianBarbadianBasqueBelgianBelizeanBermudanBhutaneseBlackfeetBolivianBrazilianBritishBritish West IndianBulgarianBurmeseCajunCambodianCanadianCape VerdeanCarpatho RusynCelticCentral AmericanCentral American IndianCherokeeCheyenneChickasawChileanChineseChippewaChoctawColombianColvilleComancheCosta RicanCreeCreekCroatianCrowCubanCypriotCzechCzechoslovakianDanishDelawareDominicanDutchDutch West IndianEastern EuropeanEcuadorianEgyptianEnglishEstonianEthiopianEuropeanFijianFilipinoFinnishFrenchFrench American IndianFrench CanadianGermanGerman RussianGhanaianGreekGuamanian/ChamorroGuatemalanGuyaneseHaitianHmongHonduranHopiHoumaHungarianIcelanderIndian (Asian)IndonesianInupiatIranianIraqiIrishIroquoisIsraeliItalianJamaicanJapaneseJordanianKenyanKiowaKoreanLaotianLatvianLebaneseLiberianLithuanianLumbeeLuxembourgerMacedonianMalaysianMalteseMarshalleseMenomineeMexicanMexican American IndianMongolianMoroccanNative HawaiianNavajoNepaleseNew ZealanderNicaraguanNigerianNorthern EuropeanNorwegianOkinawanOsageOttawaPaiutePakistaniPalestinianPanamanianParaguayanPennsylvania GermanPeruvianPimaPolishPortuguesePotawatomiPuebloPuerto RicanPuget Sound SalishRomanianRussianSalvadoranSamoanScandinavianScotch-IrishScottishSeminoleSenegaleseSerbianShoshoneSierra LeoneanSiouxSlavicSlovakSloveneSomaliSouth AfricanSouth AmericanSouth American IndianSoviet UnionSpaniardSpanishSpanish AmericanSpanish American IndianSri LankanSubsaharan AfricanSudaneseSwedishSwissSyrianTaiwaneseThaiTlingit-HaidaTohono O'OdhamTonganTrinidadian and TobagonianTsimshianTurkishU.S. Virgin IslanderUgandanUkrainianUruguayanUteVenezuelanVietnameseWelshWest IndianYakamaYaquiYugoslavianYumanYup'ikZimbabwean
Immigration
NonimmigrantsImmigrantsAfghanistanAfricaAlbaniaArgentinaArmeniaAsiaAustraliaAustriaBahamasBangladeshBarbadosBelarusBelgiumBelizeBoliviaBosnia and HerzegovinaBrazilBulgariaBurma/MyanmarCabo VerdeCambodiaCameroonCanadaCaribbeanCentral AmericaChileChinaColombiaCongoCosta RicaCroatiaCubaCzechoslovakiaDenmarkDominicaDominican RepublicEastern AfricaEastern AsiaEastern EuropeEcuadorEgyptEl SalvadorEnglandEritreaEthiopiaEuropeFijiFranceGermanyGhanaGreeceGrenadaGuatemalaGuyanaHaitiHondurasHong KongHungaryIndiaIndonesiaIranIraqIrelandIsraelItalyJamaicaJapanJordanKazakhstanKenyaKoreaKuwaitLaosLatin AmericaLatviaLebanonLiberiaLithuaniaMalaysiaMexicoMicronesiaMiddle AfricaMoldovaMoroccoNepalNetherlandsNicaraguaNigeriaNorth AmericaNorth MacedoniaNorthern AfricaNorthern EuropeNorwayOceaniaPakistanPanamaPeruPhilippinesPolandPortugalRomaniaRussiaSaudi ArabiaScotlandSenegalSerbiaSierra LeoneSingaporeSomaliaSouth AfricaSouth AmericaSouth Central AsiaSouth Eastern AsiaSouthern EuropeSpainSri LankaSt. Vincent and the GrenadinesSudanSwedenSwitzerlandSyriaTaiwanThailandTrinidad and TobagoTurkeyUgandaUkraineUruguayUzbekistanVenezuelaVietnamWest IndiesWestern AfricaWestern AsiaWestern EuropeYemenZaireZimbabweAzores
Doctorate Degree
Income
Poverty
Unemployment
Labor Participation
Family Structure
Vehicle Availability
Education Level
Disability

Doctorate Degree Comparison

Bangladeshis

Immigrants from Italy

Tragic
Exceptional
1.2%
DOCTORATE DEGREE
0.0/ 100
METRIC RATING
337th/ 347
METRIC RANK
2.1%
DOCTORATE DEGREE
96.9/ 100
METRIC RATING
113th/ 347
METRIC RANK

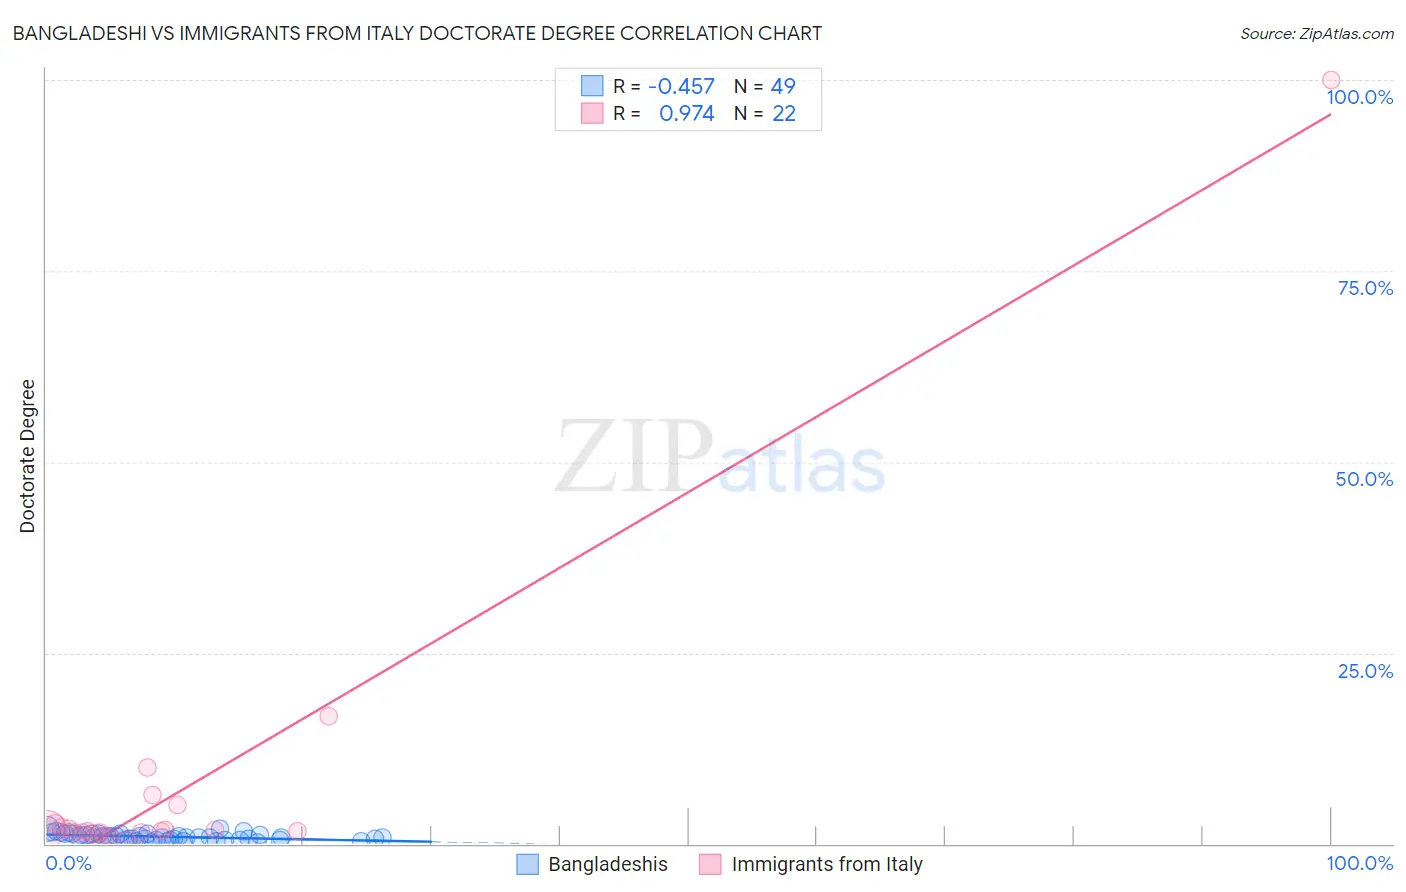
Bangladeshi vs Immigrants from Italy Doctorate Degree Correlation Chart

The statistical analysis conducted on geographies consisting of 140,269,397 people shows a moderate negative correlation between the proportion of Bangladeshis and percentage of population with at least doctorate degree education in the United States with a correlation coefficient (R) of -0.457 and weighted average of 1.2%. Similarly, the statistical analysis conducted on geographies consisting of 322,534,686 people shows a perfect positive correlation between the proportion of Immigrants from Italy and percentage of population with at least doctorate degree education in the United States with a correlation coefficient (R) of 0.974 and weighted average of 2.1%, a difference of 71.0%.
Bangladeshi vs Immigrants from Italy Doctorate Degree

Doctorate Degree Correlation Summary

MeasurementBangladeshiImmigrants from Italy
Minimum0.12%0.55%
Maximum2.0%100.0%
Range1.9%99.5%
Mean0.92%7.5%
Median0.87%1.7%
Interquartile 25% (IQ1)0.56%1.4%
Interquartile 75% (IQ3)1.3%2.6%
Interquartile Range (IQR)0.72%1.2%
Standard Deviation (Sample)0.45%21.0%
Standard Deviation (Population)0.45%20.5%

Similar Demographics by Doctorate Degree

Demographics Similar to Bangladeshis by Doctorate Degree

In terms of doctorate degree, the demographic groups most similar to Bangladeshis are Puget Sound Salish (1.2%, a difference of 0.75%), Immigrants from Central America (1.2%, a difference of 2.1%), Immigrants from Cuba (1.2%, a difference of 2.9%), Mexican (1.2%, a difference of 3.4%), and Nepalese (1.3%, a difference of 3.5%).
DemographicsRating | RankDoctorate Degree
Yup'ik
0.0
/100
|
#330
Tragic
1.3%
Immigrants | Latin America
0.0
/100
|
#331
Tragic
1.3%
Yakama
0.0
/100
|
#332
Tragic
1.3%
Immigrants | Caribbean
0.0
/100
|
#333
Tragic
1.3%
Immigrants | Dominican Republic
0.0
/100
|
#334
Tragic
1.3%
Immigrants | Haiti
0.0
/100
|
#335
Tragic
1.3%
Nepalese
0.0
/100
|
#336
Tragic
1.3%
Bangladeshis
0.0
/100
|
#337
Tragic
1.2%
Puget Sound Salish
0.0
/100
|
#338
Tragic
1.2%
Immigrants | Central America
0.0
/100
|
#339
Tragic
1.2%
Immigrants | Cuba
0.0
/100
|
#340
Tragic
1.2%
Mexicans
0.0
/100
|
#341
Tragic
1.2%
Arapaho
0.0
/100
|
#342
Tragic
1.2%
Fijians
0.0
/100
|
#343
Tragic
1.1%
Immigrants | Mexico
0.0
/100
|
#344
Tragic
1.1%

Demographics Similar to Immigrants from Italy by Doctorate Degree

In terms of doctorate degree, the demographic groups most similar to Immigrants from Italy are Immigrants from Croatia (2.1%, a difference of 0.15%), Syrian (2.1%, a difference of 0.21%), Immigrants from Pakistan (2.1%, a difference of 0.23%), Taiwanese (2.1%, a difference of 0.23%), and Brazilian (2.1%, a difference of 0.29%).
DemographicsRating | RankDoctorate Degree
Sudanese
97.7
/100
|
#106
Exceptional
2.1%
Europeans
97.5
/100
|
#107
Exceptional
2.1%
Immigrants | Germany
97.3
/100
|
#108
Exceptional
2.1%
Ukrainians
97.2
/100
|
#109
Exceptional
2.1%
Brazilians
97.2
/100
|
#110
Exceptional
2.1%
Immigrants | Pakistan
97.1
/100
|
#111
Exceptional
2.1%
Syrians
97.1
/100
|
#112
Exceptional
2.1%
Immigrants | Italy
96.9
/100
|
#113
Exceptional
2.1%
Immigrants | Croatia
96.8
/100
|
#114
Exceptional
2.1%
Taiwanese
96.7
/100
|
#115
Exceptional
2.1%
Maltese
96.2
/100
|
#116
Exceptional
2.1%
Lebanese
96.0
/100
|
#117
Exceptional
2.1%
Icelanders
96.0
/100
|
#118
Exceptional
2.1%
Pakistanis
95.8
/100
|
#119
Exceptional
2.0%
Immigrants | Morocco
95.5
/100
|
#120
Exceptional
2.0%