Bangladeshi vs Nicaraguan Doctorate Degree
COMPARE
Bangladeshi
Nicaraguan
Doctorate Degree
Doctorate Degree Comparison
Bangladeshis
Nicaraguans
1.2%
DOCTORATE DEGREE
0.0/ 100
METRIC RATING
337th/ 347
METRIC RANK
1.5%
DOCTORATE DEGREE
0.6/ 100
METRIC RATING
265th/ 347
METRIC RANK
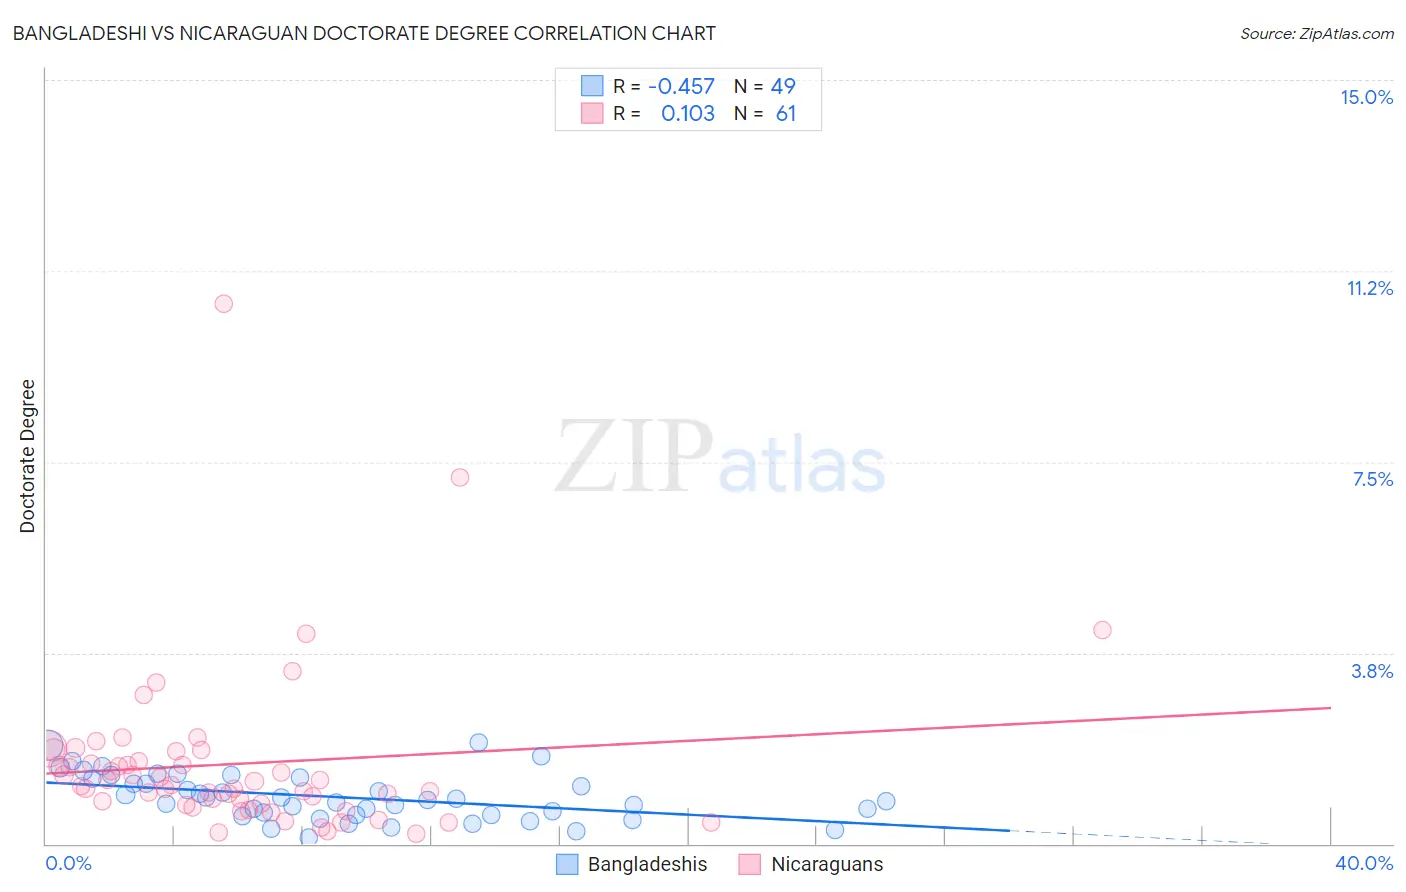
Bangladeshi vs Nicaraguan Doctorate Degree Correlation Chart
The statistical analysis conducted on geographies consisting of 140,269,397 people shows a moderate negative correlation between the proportion of Bangladeshis and percentage of population with at least doctorate degree education in the United States with a correlation coefficient (R) of -0.457 and weighted average of 1.2%. Similarly, the statistical analysis conducted on geographies consisting of 283,726,433 people shows a poor positive correlation between the proportion of Nicaraguans and percentage of population with at least doctorate degree education in the United States with a correlation coefficient (R) of 0.103 and weighted average of 1.5%, a difference of 23.8%.
Doctorate Degree Correlation Summary
| Measurement | Bangladeshi | Nicaraguan |
| Minimum | 0.12% | 0.20% |
| Maximum | 2.0% | 10.6% |
| Range | 1.9% | 10.4% |
| Mean | 0.92% | 1.6% |
| Median | 0.87% | 1.2% |
| Interquartile 25% (IQ1) | 0.56% | 0.78% |
| Interquartile 75% (IQ3) | 1.3% | 1.7% |
| Interquartile Range (IQR) | 0.72% | 0.94% |
| Standard Deviation (Sample) | 0.45% | 1.6% |
| Standard Deviation (Population) | 0.45% | 1.6% |
Similar Demographics by Doctorate Degree
Demographics Similar to Bangladeshis by Doctorate Degree
In terms of doctorate degree, the demographic groups most similar to Bangladeshis are Puget Sound Salish (1.2%, a difference of 0.75%), Immigrants from Central America (1.2%, a difference of 2.1%), Immigrants from Cuba (1.2%, a difference of 2.9%), Mexican (1.2%, a difference of 3.4%), and Nepalese (1.3%, a difference of 3.5%).
| Demographics | Rating | Rank | Doctorate Degree |
| Yup'ik | 0.0 /100 | #330 | Tragic 1.3% |
| Immigrants | Latin America | 0.0 /100 | #331 | Tragic 1.3% |
| Yakama | 0.0 /100 | #332 | Tragic 1.3% |
| Immigrants | Caribbean | 0.0 /100 | #333 | Tragic 1.3% |
| Immigrants | Dominican Republic | 0.0 /100 | #334 | Tragic 1.3% |
| Immigrants | Haiti | 0.0 /100 | #335 | Tragic 1.3% |
| Nepalese | 0.0 /100 | #336 | Tragic 1.3% |
| Bangladeshis | 0.0 /100 | #337 | Tragic 1.2% |
| Puget Sound Salish | 0.0 /100 | #338 | Tragic 1.2% |
| Immigrants | Central America | 0.0 /100 | #339 | Tragic 1.2% |
| Immigrants | Cuba | 0.0 /100 | #340 | Tragic 1.2% |
| Mexicans | 0.0 /100 | #341 | Tragic 1.2% |
| Arapaho | 0.0 /100 | #342 | Tragic 1.2% |
| Fijians | 0.0 /100 | #343 | Tragic 1.1% |
| Immigrants | Mexico | 0.0 /100 | #344 | Tragic 1.1% |
Demographics Similar to Nicaraguans by Doctorate Degree
In terms of doctorate degree, the demographic groups most similar to Nicaraguans are Blackfeet (1.5%, a difference of 0.28%), Immigrants from Bahamas (1.5%, a difference of 0.47%), Chickasaw (1.5%, a difference of 0.64%), Immigrants from Liberia (1.5%, a difference of 0.78%), and Immigrants from Portugal (1.5%, a difference of 0.79%).
| Demographics | Rating | Rank | Doctorate Degree |
| Immigrants | West Indies | 0.9 /100 | #258 | Tragic 1.5% |
| Liberians | 0.9 /100 | #259 | Tragic 1.5% |
| Japanese | 0.9 /100 | #260 | Tragic 1.5% |
| Immigrants | Portugal | 0.8 /100 | #261 | Tragic 1.5% |
| Chickasaw | 0.7 /100 | #262 | Tragic 1.5% |
| Immigrants | Bahamas | 0.7 /100 | #263 | Tragic 1.5% |
| Blackfeet | 0.7 /100 | #264 | Tragic 1.5% |
| Nicaraguans | 0.6 /100 | #265 | Tragic 1.5% |
| Immigrants | Liberia | 0.5 /100 | #266 | Tragic 1.5% |
| Kiowa | 0.5 /100 | #267 | Tragic 1.5% |
| U.S. Virgin Islanders | 0.5 /100 | #268 | Tragic 1.5% |
| Crow | 0.5 /100 | #269 | Tragic 1.5% |
| Salvadorans | 0.5 /100 | #270 | Tragic 1.5% |
| Immigrants | Trinidad and Tobago | 0.5 /100 | #271 | Tragic 1.5% |
| Immigrants | Barbados | 0.4 /100 | #272 | Tragic 1.5% |