Bangladeshi vs Immigrants from Ethiopia Bachelor's Degree
COMPARE
Bangladeshi
Immigrants from Ethiopia
Bachelor's Degree
Bachelor's Degree Comparison
Bangladeshis
Immigrants from Ethiopia
30.2%
BACHELOR'S DEGREE
0.0/ 100
METRIC RATING
303rd/ 347
METRIC RANK
42.5%
BACHELOR'S DEGREE
99.4/ 100
METRIC RATING
78th/ 347
METRIC RANK
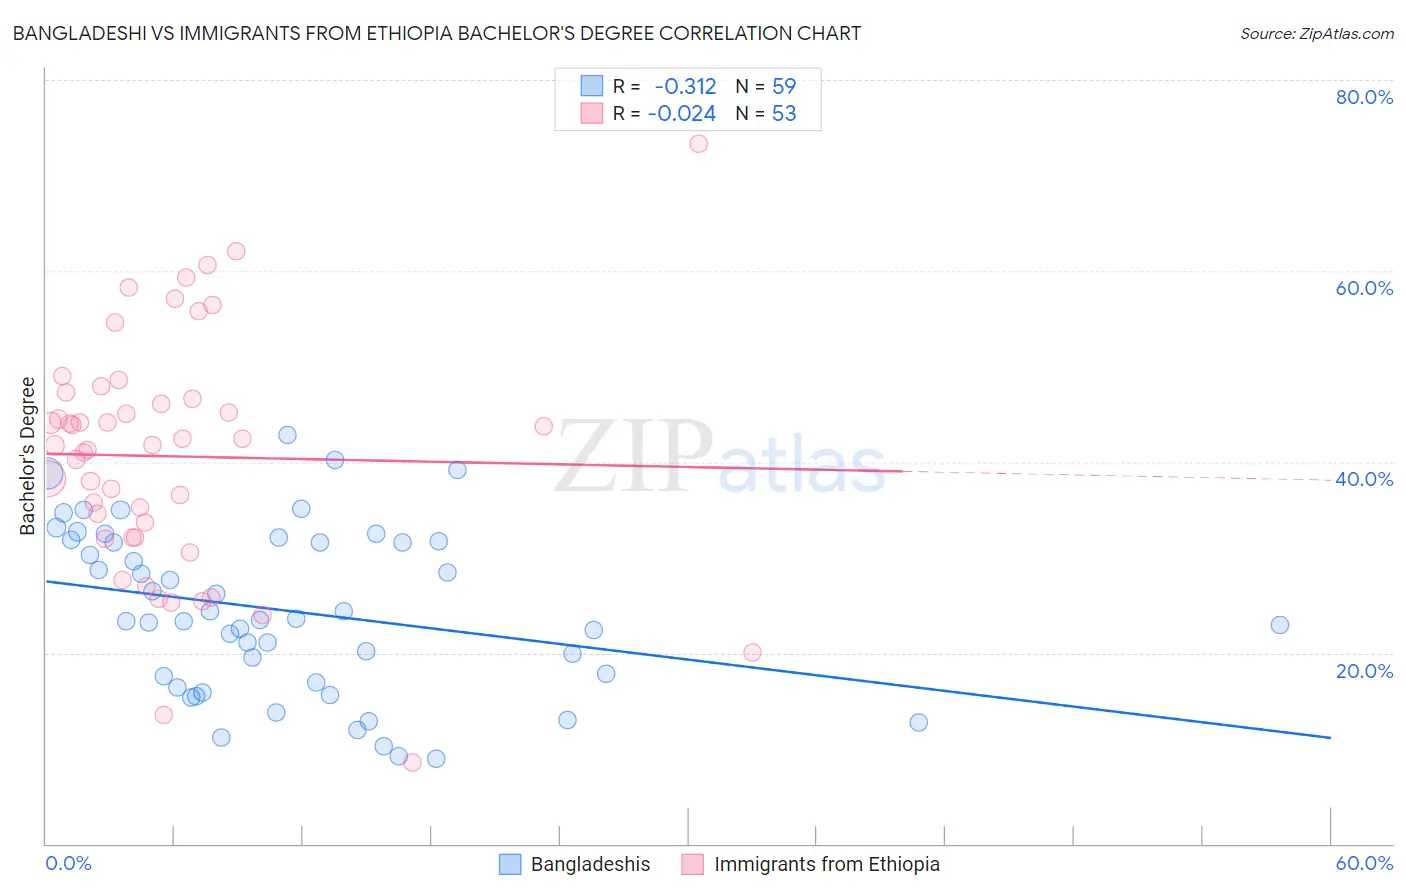
Bangladeshi vs Immigrants from Ethiopia Bachelor's Degree Correlation Chart
The statistical analysis conducted on geographies consisting of 141,448,336 people shows a mild negative correlation between the proportion of Bangladeshis and percentage of population with at least bachelor's degree education in the United States with a correlation coefficient (R) of -0.312 and weighted average of 30.2%. Similarly, the statistical analysis conducted on geographies consisting of 211,546,293 people shows no correlation between the proportion of Immigrants from Ethiopia and percentage of population with at least bachelor's degree education in the United States with a correlation coefficient (R) of -0.024 and weighted average of 42.5%, a difference of 40.7%.
Bachelor's Degree Correlation Summary
| Measurement | Bangladeshi | Immigrants from Ethiopia |
| Minimum | 8.9% | 8.6% |
| Maximum | 42.8% | 73.3% |
| Range | 33.9% | 64.8% |
| Mean | 24.4% | 40.6% |
| Median | 23.4% | 41.8% |
| Interquartile 25% (IQ1) | 16.8% | 32.1% |
| Interquartile 75% (IQ3) | 31.7% | 46.9% |
| Interquartile Range (IQR) | 14.8% | 14.8% |
| Standard Deviation (Sample) | 8.6% | 12.6% |
| Standard Deviation (Population) | 8.6% | 12.4% |
Similar Demographics by Bachelor's Degree
Demographics Similar to Bangladeshis by Bachelor's Degree
In terms of bachelor's degree, the demographic groups most similar to Bangladeshis are Cherokee (30.2%, a difference of 0.010%), Mexican American Indian (30.2%, a difference of 0.17%), Immigrants from Latin America (30.1%, a difference of 0.43%), Immigrants from Cuba (30.3%, a difference of 0.45%), and Immigrants from Micronesia (30.4%, a difference of 0.66%).
| Demographics | Rating | Rank | Bachelor's Degree |
| Puget Sound Salish | 0.0 /100 | #296 | Tragic 30.7% |
| Immigrants | Haiti | 0.0 /100 | #297 | Tragic 30.6% |
| Chippewa | 0.0 /100 | #298 | Tragic 30.6% |
| Chickasaw | 0.0 /100 | #299 | Tragic 30.4% |
| Immigrants | Micronesia | 0.0 /100 | #300 | Tragic 30.4% |
| Immigrants | Cuba | 0.0 /100 | #301 | Tragic 30.3% |
| Mexican American Indians | 0.0 /100 | #302 | Tragic 30.2% |
| Bangladeshis | 0.0 /100 | #303 | Tragic 30.2% |
| Cherokee | 0.0 /100 | #304 | Tragic 30.2% |
| Immigrants | Latin America | 0.0 /100 | #305 | Tragic 30.1% |
| Immigrants | Yemen | 0.0 /100 | #306 | Tragic 29.9% |
| Nepalese | 0.0 /100 | #307 | Tragic 29.9% |
| Cajuns | 0.0 /100 | #308 | Tragic 29.6% |
| Hispanics or Latinos | 0.0 /100 | #309 | Tragic 29.6% |
| Cheyenne | 0.0 /100 | #310 | Tragic 29.4% |
Demographics Similar to Immigrants from Ethiopia by Bachelor's Degree
In terms of bachelor's degree, the demographic groups most similar to Immigrants from Ethiopia are Immigrants from Eastern Europe (42.5%, a difference of 0.060%), Immigrants from Lebanon (42.4%, a difference of 0.17%), Immigrants from Egypt (42.6%, a difference of 0.24%), Immigrants from Zimbabwe (42.6%, a difference of 0.26%), and Immigrants from Croatia (42.3%, a difference of 0.36%).
| Demographics | Rating | Rank | Bachelor's Degree |
| Immigrants | Argentina | 99.6 /100 | #71 | Exceptional 42.8% |
| Ethiopians | 99.5 /100 | #72 | Exceptional 42.8% |
| Immigrants | Uzbekistan | 99.5 /100 | #73 | Exceptional 42.8% |
| Bhutanese | 99.5 /100 | #74 | Exceptional 42.7% |
| Immigrants | Zimbabwe | 99.4 /100 | #75 | Exceptional 42.6% |
| Immigrants | Egypt | 99.4 /100 | #76 | Exceptional 42.6% |
| Immigrants | Eastern Europe | 99.4 /100 | #77 | Exceptional 42.5% |
| Immigrants | Ethiopia | 99.4 /100 | #78 | Exceptional 42.5% |
| Immigrants | Lebanon | 99.3 /100 | #79 | Exceptional 42.4% |
| Immigrants | Croatia | 99.2 /100 | #80 | Exceptional 42.3% |
| Immigrants | Hungary | 99.2 /100 | #81 | Exceptional 42.3% |
| Immigrants | Scotland | 99.2 /100 | #82 | Exceptional 42.3% |
| Armenians | 99.2 /100 | #83 | Exceptional 42.3% |
| Immigrants | Western Asia | 99.2 /100 | #84 | Exceptional 42.3% |
| Lithuanians | 99.2 /100 | #85 | Exceptional 42.2% |