Bangladeshi vs Eastern European Bachelor's Degree
COMPARE
Bangladeshi
Eastern European
Bachelor's Degree
Bachelor's Degree Comparison
Bangladeshis
Eastern Europeans
30.2%
BACHELOR'S DEGREE
0.0/ 100
METRIC RATING
303rd/ 347
METRIC RANK
47.5%
BACHELOR'S DEGREE
100.0/ 100
METRIC RATING
17th/ 347
METRIC RANK
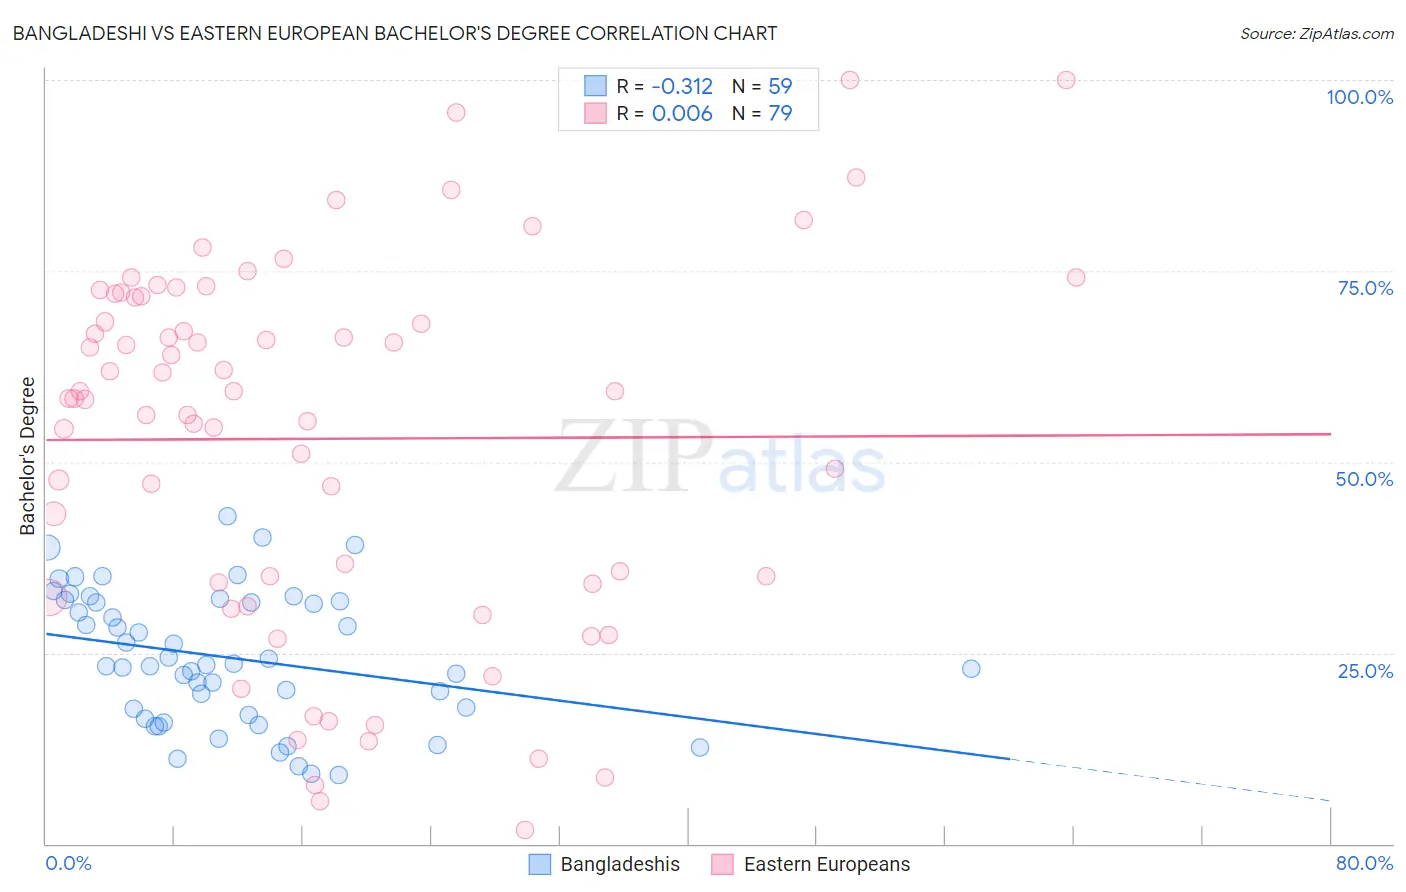
Bangladeshi vs Eastern European Bachelor's Degree Correlation Chart
The statistical analysis conducted on geographies consisting of 141,448,336 people shows a mild negative correlation between the proportion of Bangladeshis and percentage of population with at least bachelor's degree education in the United States with a correlation coefficient (R) of -0.312 and weighted average of 30.2%. Similarly, the statistical analysis conducted on geographies consisting of 461,197,677 people shows no correlation between the proportion of Eastern Europeans and percentage of population with at least bachelor's degree education in the United States with a correlation coefficient (R) of 0.006 and weighted average of 47.5%, a difference of 57.4%.
Bachelor's Degree Correlation Summary
| Measurement | Bangladeshi | Eastern European |
| Minimum | 8.9% | 1.8% |
| Maximum | 42.8% | 100.0% |
| Range | 33.9% | 98.2% |
| Mean | 24.4% | 53.0% |
| Median | 23.4% | 58.3% |
| Interquartile 25% (IQ1) | 16.8% | 34.0% |
| Interquartile 75% (IQ3) | 31.7% | 71.7% |
| Interquartile Range (IQR) | 14.8% | 37.7% |
| Standard Deviation (Sample) | 8.6% | 24.1% |
| Standard Deviation (Population) | 8.6% | 23.9% |
Similar Demographics by Bachelor's Degree
Demographics Similar to Bangladeshis by Bachelor's Degree
In terms of bachelor's degree, the demographic groups most similar to Bangladeshis are Cherokee (30.2%, a difference of 0.010%), Mexican American Indian (30.2%, a difference of 0.17%), Immigrants from Latin America (30.1%, a difference of 0.43%), Immigrants from Cuba (30.3%, a difference of 0.45%), and Immigrants from Micronesia (30.4%, a difference of 0.66%).
| Demographics | Rating | Rank | Bachelor's Degree |
| Puget Sound Salish | 0.0 /100 | #296 | Tragic 30.7% |
| Immigrants | Haiti | 0.0 /100 | #297 | Tragic 30.6% |
| Chippewa | 0.0 /100 | #298 | Tragic 30.6% |
| Chickasaw | 0.0 /100 | #299 | Tragic 30.4% |
| Immigrants | Micronesia | 0.0 /100 | #300 | Tragic 30.4% |
| Immigrants | Cuba | 0.0 /100 | #301 | Tragic 30.3% |
| Mexican American Indians | 0.0 /100 | #302 | Tragic 30.2% |
| Bangladeshis | 0.0 /100 | #303 | Tragic 30.2% |
| Cherokee | 0.0 /100 | #304 | Tragic 30.2% |
| Immigrants | Latin America | 0.0 /100 | #305 | Tragic 30.1% |
| Immigrants | Yemen | 0.0 /100 | #306 | Tragic 29.9% |
| Nepalese | 0.0 /100 | #307 | Tragic 29.9% |
| Cajuns | 0.0 /100 | #308 | Tragic 29.6% |
| Hispanics or Latinos | 0.0 /100 | #309 | Tragic 29.6% |
| Cheyenne | 0.0 /100 | #310 | Tragic 29.4% |
Demographics Similar to Eastern Europeans by Bachelor's Degree
In terms of bachelor's degree, the demographic groups most similar to Eastern Europeans are Indian (Asian) (47.4%, a difference of 0.15%), Cambodian (47.2%, a difference of 0.58%), Immigrants from Switzerland (47.1%, a difference of 0.80%), Immigrants from Ireland (47.1%, a difference of 0.81%), and Soviet Union (47.9%, a difference of 0.86%).
| Demographics | Rating | Rank | Bachelor's Degree |
| Cypriots | 100.0 /100 | #10 | Exceptional 49.0% |
| Immigrants | Australia | 100.0 /100 | #11 | Exceptional 48.5% |
| Immigrants | China | 100.0 /100 | #12 | Exceptional 48.4% |
| Immigrants | South Central Asia | 100.0 /100 | #13 | Exceptional 48.3% |
| Immigrants | Hong Kong | 100.0 /100 | #14 | Exceptional 48.2% |
| Immigrants | Eastern Asia | 100.0 /100 | #15 | Exceptional 48.1% |
| Soviet Union | 100.0 /100 | #16 | Exceptional 47.9% |
| Eastern Europeans | 100.0 /100 | #17 | Exceptional 47.5% |
| Indians (Asian) | 100.0 /100 | #18 | Exceptional 47.4% |
| Cambodians | 100.0 /100 | #19 | Exceptional 47.2% |
| Immigrants | Switzerland | 100.0 /100 | #20 | Exceptional 47.1% |
| Immigrants | Ireland | 100.0 /100 | #21 | Exceptional 47.1% |
| Immigrants | Belgium | 100.0 /100 | #22 | Exceptional 47.0% |
| Immigrants | Sweden | 100.0 /100 | #23 | Exceptional 47.0% |
| Immigrants | Korea | 100.0 /100 | #24 | Exceptional 47.0% |