Immigrants from Egypt vs Chippewa High School Diploma
COMPARE
Immigrants from Egypt
Chippewa
High School Diploma
High School Diploma Comparison
Immigrants from Egypt
Chippewa
89.6%
HIGH SCHOOL DIPLOMA
81.2/ 100
METRIC RATING
140th/ 347
METRIC RANK
89.7%
HIGH SCHOOL DIPLOMA
85.6/ 100
METRIC RATING
135th/ 347
METRIC RANK
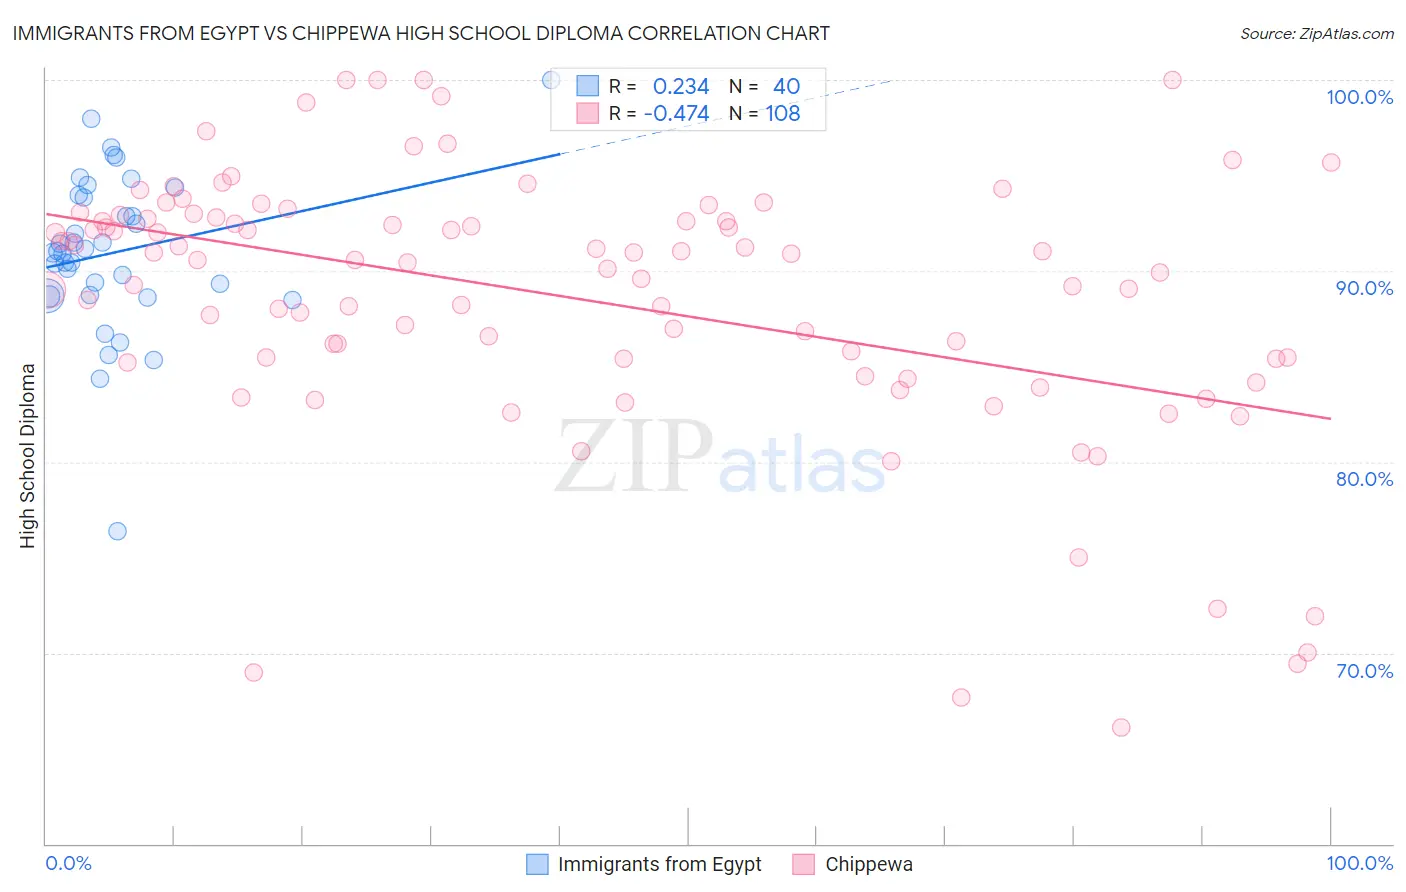
Immigrants from Egypt vs Chippewa High School Diploma Correlation Chart
The statistical analysis conducted on geographies consisting of 245,484,455 people shows a weak positive correlation between the proportion of Immigrants from Egypt and percentage of population with at least high school diploma education in the United States with a correlation coefficient (R) of 0.234 and weighted average of 89.6%. Similarly, the statistical analysis conducted on geographies consisting of 215,068,347 people shows a moderate negative correlation between the proportion of Chippewa and percentage of population with at least high school diploma education in the United States with a correlation coefficient (R) of -0.474 and weighted average of 89.7%, a difference of 0.12%.
High School Diploma Correlation Summary
| Measurement | Immigrants from Egypt | Chippewa |
| Minimum | 76.3% | 66.1% |
| Maximum | 100.0% | 100.0% |
| Range | 23.7% | 33.9% |
| Mean | 91.0% | 88.6% |
| Median | 91.0% | 90.6% |
| Interquartile 25% (IQ1) | 88.7% | 85.4% |
| Interquartile 75% (IQ3) | 93.9% | 92.8% |
| Interquartile Range (IQR) | 5.2% | 7.4% |
| Standard Deviation (Sample) | 4.2% | 7.0% |
| Standard Deviation (Population) | 4.2% | 7.0% |
Demographics Similar to Immigrants from Egypt and Chippewa by High School Diploma
In terms of high school diploma, the demographic groups most similar to Immigrants from Egypt are Kenyan (89.6%, a difference of 0.010%), Assyrian/Chaldean/Syriac (89.7%, a difference of 0.030%), Chilean (89.6%, a difference of 0.050%), Arab (89.7%, a difference of 0.060%), and Indian (Asian) (89.6%, a difference of 0.060%). Similarly, the demographic groups most similar to Chippewa are Immigrants from Bosnia and Herzegovina (89.8%, a difference of 0.050%), Albanian (89.8%, a difference of 0.050%), Immigrants from Jordan (89.8%, a difference of 0.050%), Immigrants from Italy (89.8%, a difference of 0.060%), and Ugandan (89.7%, a difference of 0.060%).
| Demographics | Rating | Rank | High School Diploma |
| Immigrants | Eastern Asia | 89.2 /100 | #127 | Excellent 89.9% |
| Puget Sound Salish | 89.1 /100 | #128 | Excellent 89.9% |
| Basques | 88.5 /100 | #129 | Excellent 89.8% |
| Immigrants | Ukraine | 87.9 /100 | #130 | Excellent 89.8% |
| Immigrants | Italy | 87.4 /100 | #131 | Excellent 89.8% |
| Immigrants | Bosnia and Herzegovina | 87.3 /100 | #132 | Excellent 89.8% |
| Albanians | 87.2 /100 | #133 | Excellent 89.8% |
| Immigrants | Jordan | 87.2 /100 | #134 | Excellent 89.8% |
| Chippewa | 85.6 /100 | #135 | Excellent 89.7% |
| Ugandans | 83.7 /100 | #136 | Excellent 89.7% |
| Arabs | 83.6 /100 | #137 | Excellent 89.7% |
| Assyrians/Chaldeans/Syriacs | 82.5 /100 | #138 | Excellent 89.7% |
| Kenyans | 81.4 /100 | #139 | Excellent 89.6% |
| Immigrants | Egypt | 81.2 /100 | #140 | Excellent 89.6% |
| Chileans | 79.0 /100 | #141 | Good 89.6% |
| Indians (Asian) | 78.8 /100 | #142 | Good 89.6% |
| Pakistanis | 78.3 /100 | #143 | Good 89.6% |
| Immigrants | Kenya | 78.0 /100 | #144 | Good 89.6% |
| Immigrants | Brazil | 76.6 /100 | #145 | Good 89.5% |
| Immigrants | Spain | 76.2 /100 | #146 | Good 89.5% |
| Iraqis | 73.9 /100 | #147 | Good 89.5% |