Immigrants from Japan vs Chippewa High School Diploma
COMPARE
Immigrants from Japan
Chippewa
High School Diploma
High School Diploma Comparison
Immigrants from Japan
Chippewa
91.0%
HIGH SCHOOL DIPLOMA
99.6/ 100
METRIC RATING
60th/ 347
METRIC RANK
89.7%
HIGH SCHOOL DIPLOMA
85.6/ 100
METRIC RATING
135th/ 347
METRIC RANK
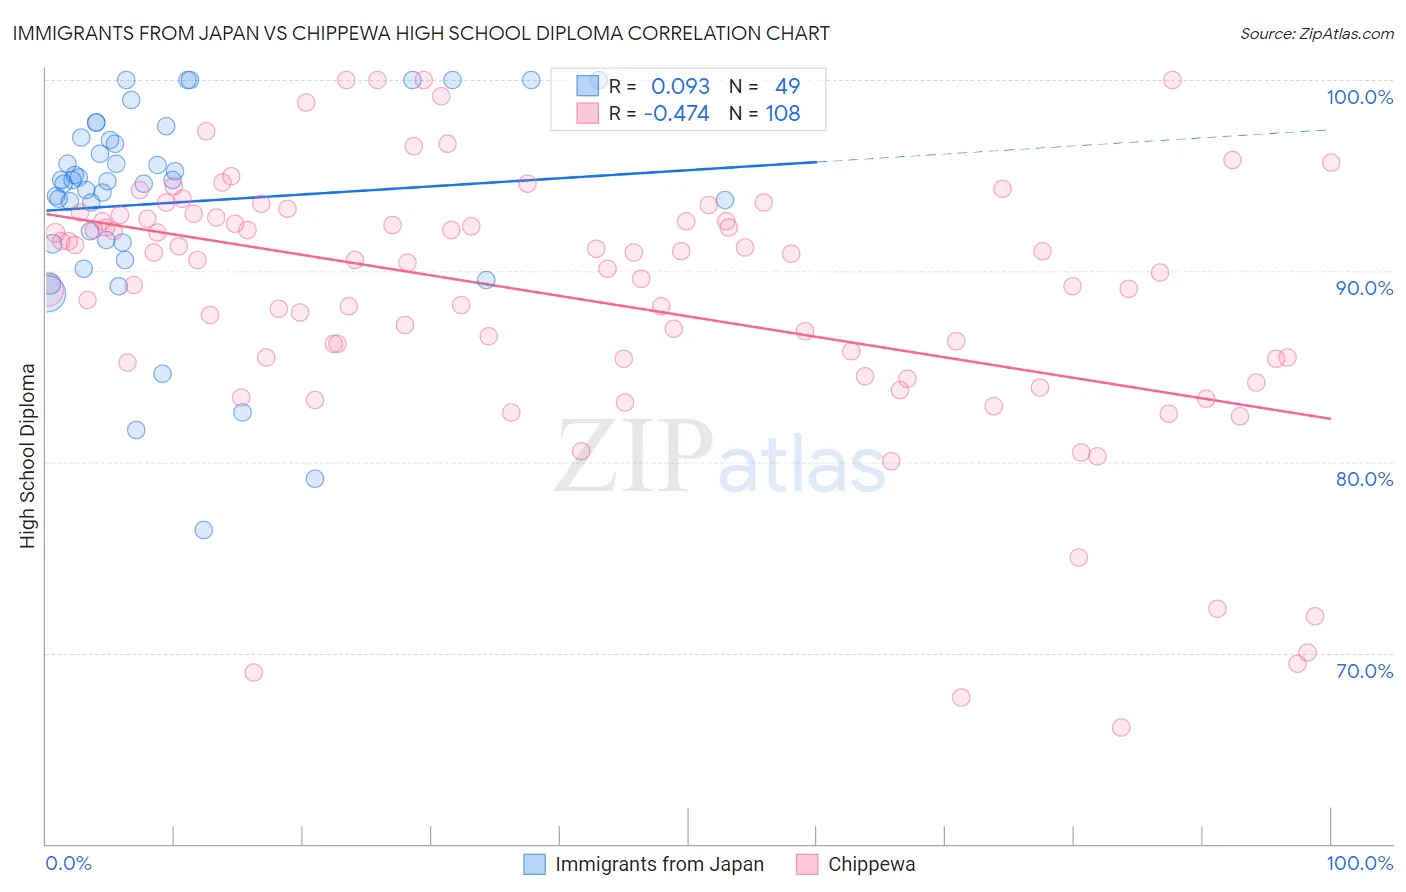
Immigrants from Japan vs Chippewa High School Diploma Correlation Chart
The statistical analysis conducted on geographies consisting of 340,148,942 people shows a slight positive correlation between the proportion of Immigrants from Japan and percentage of population with at least high school diploma education in the United States with a correlation coefficient (R) of 0.093 and weighted average of 91.0%. Similarly, the statistical analysis conducted on geographies consisting of 215,068,347 people shows a moderate negative correlation between the proportion of Chippewa and percentage of population with at least high school diploma education in the United States with a correlation coefficient (R) of -0.474 and weighted average of 89.7%, a difference of 1.4%.
High School Diploma Correlation Summary
| Measurement | Immigrants from Japan | Chippewa |
| Minimum | 76.5% | 66.1% |
| Maximum | 100.0% | 100.0% |
| Range | 23.5% | 33.9% |
| Mean | 93.6% | 88.6% |
| Median | 94.7% | 90.6% |
| Interquartile 25% (IQ1) | 91.4% | 85.4% |
| Interquartile 75% (IQ3) | 96.9% | 92.8% |
| Interquartile Range (IQR) | 5.5% | 7.4% |
| Standard Deviation (Sample) | 5.4% | 7.0% |
| Standard Deviation (Population) | 5.3% | 7.0% |
Similar Demographics by High School Diploma
Demographics Similar to Immigrants from Japan by High School Diploma
In terms of high school diploma, the demographic groups most similar to Immigrants from Japan are Immigrants from Taiwan (91.0%, a difference of 0.010%), Slavic (91.0%, a difference of 0.030%), Immigrants from North America (91.0%, a difference of 0.030%), Austrian (91.0%, a difference of 0.030%), and Zimbabwean (91.1%, a difference of 0.040%).
| Demographics | Rating | Rank | High School Diploma |
| Immigrants | Belgium | 99.7 /100 | #53 | Exceptional 91.1% |
| Macedonians | 99.7 /100 | #54 | Exceptional 91.1% |
| Serbians | 99.7 /100 | #55 | Exceptional 91.1% |
| Immigrants | Canada | 99.7 /100 | #56 | Exceptional 91.1% |
| Zimbabweans | 99.7 /100 | #57 | Exceptional 91.1% |
| Slavs | 99.7 /100 | #58 | Exceptional 91.0% |
| Immigrants | North America | 99.7 /100 | #59 | Exceptional 91.0% |
| Immigrants | Japan | 99.6 /100 | #60 | Exceptional 91.0% |
| Immigrants | Taiwan | 99.6 /100 | #61 | Exceptional 91.0% |
| Austrians | 99.6 /100 | #62 | Exceptional 91.0% |
| Immigrants | Netherlands | 99.6 /100 | #63 | Exceptional 91.0% |
| Ukrainians | 99.6 /100 | #64 | Exceptional 91.0% |
| Immigrants | South Africa | 99.6 /100 | #65 | Exceptional 91.0% |
| French | 99.5 /100 | #66 | Exceptional 91.0% |
| Immigrants | Iran | 99.5 /100 | #67 | Exceptional 90.9% |
Demographics Similar to Chippewa by High School Diploma
In terms of high school diploma, the demographic groups most similar to Chippewa are Immigrants from Bosnia and Herzegovina (89.8%, a difference of 0.050%), Albanian (89.8%, a difference of 0.050%), Immigrants from Jordan (89.8%, a difference of 0.050%), Immigrants from Italy (89.8%, a difference of 0.060%), and Ugandan (89.7%, a difference of 0.060%).
| Demographics | Rating | Rank | High School Diploma |
| Puget Sound Salish | 89.1 /100 | #128 | Excellent 89.9% |
| Basques | 88.5 /100 | #129 | Excellent 89.8% |
| Immigrants | Ukraine | 87.9 /100 | #130 | Excellent 89.8% |
| Immigrants | Italy | 87.4 /100 | #131 | Excellent 89.8% |
| Immigrants | Bosnia and Herzegovina | 87.3 /100 | #132 | Excellent 89.8% |
| Albanians | 87.2 /100 | #133 | Excellent 89.8% |
| Immigrants | Jordan | 87.2 /100 | #134 | Excellent 89.8% |
| Chippewa | 85.6 /100 | #135 | Excellent 89.7% |
| Ugandans | 83.7 /100 | #136 | Excellent 89.7% |
| Arabs | 83.6 /100 | #137 | Excellent 89.7% |
| Assyrians/Chaldeans/Syriacs | 82.5 /100 | #138 | Excellent 89.7% |
| Kenyans | 81.4 /100 | #139 | Excellent 89.6% |
| Immigrants | Egypt | 81.2 /100 | #140 | Excellent 89.6% |
| Chileans | 79.0 /100 | #141 | Good 89.6% |
| Indians (Asian) | 78.8 /100 | #142 | Good 89.6% |