Bahamian vs Uruguayan Bachelor's Degree
COMPARE
Bahamian
Uruguayan
Bachelor's Degree
Bachelor's Degree Comparison
Bahamians
Uruguayans
32.5%
BACHELOR'S DEGREE
0.3/ 100
METRIC RATING
265th/ 347
METRIC RANK
38.4%
BACHELOR'S DEGREE
65.8/ 100
METRIC RATING
161st/ 347
METRIC RANK
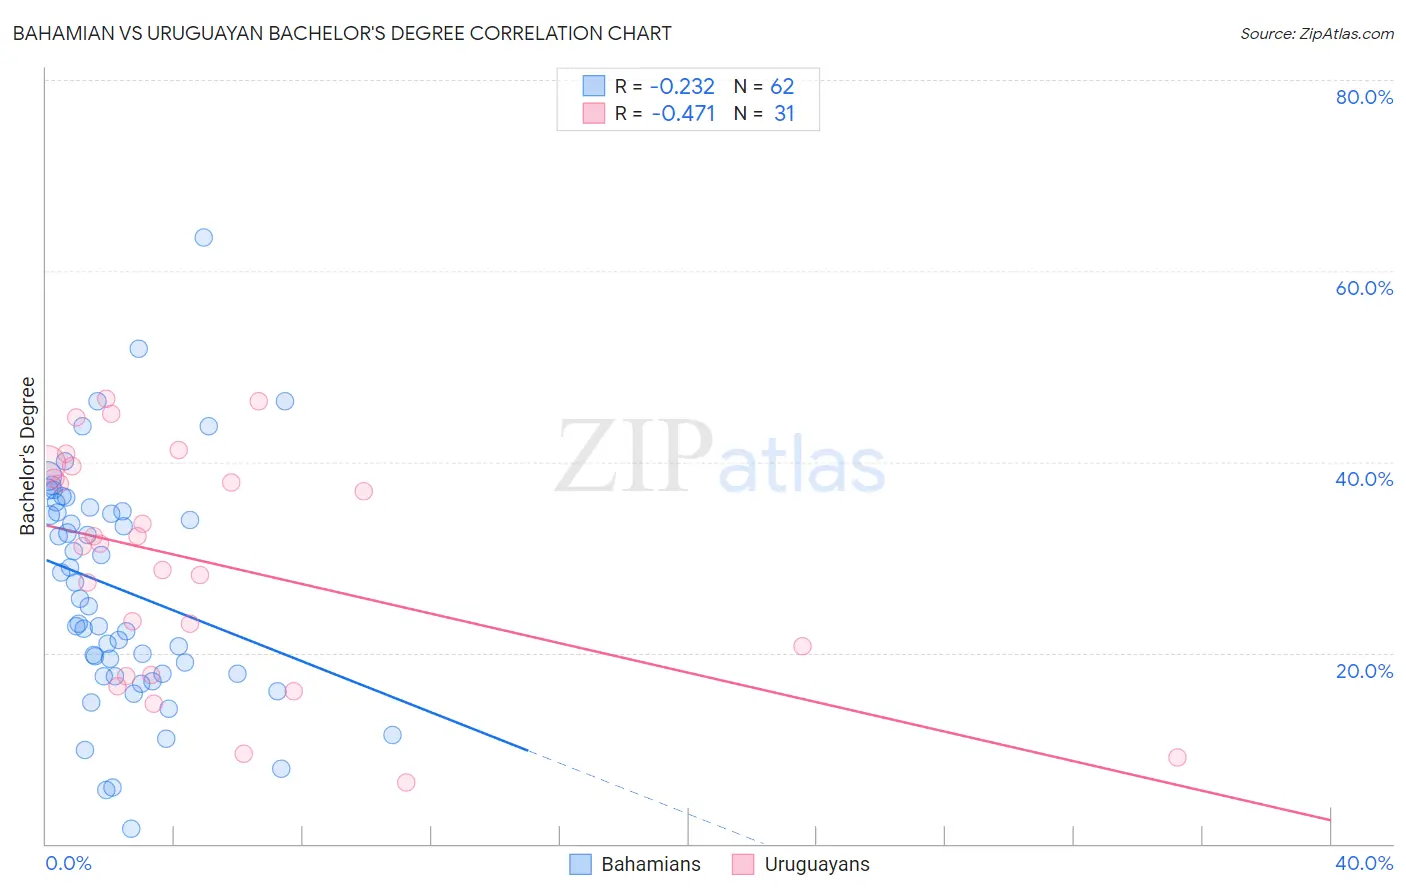
Bahamian vs Uruguayan Bachelor's Degree Correlation Chart
The statistical analysis conducted on geographies consisting of 112,698,493 people shows a weak negative correlation between the proportion of Bahamians and percentage of population with at least bachelor's degree education in the United States with a correlation coefficient (R) of -0.232 and weighted average of 32.5%. Similarly, the statistical analysis conducted on geographies consisting of 144,782,470 people shows a moderate negative correlation between the proportion of Uruguayans and percentage of population with at least bachelor's degree education in the United States with a correlation coefficient (R) of -0.471 and weighted average of 38.4%, a difference of 18.1%.
Bachelor's Degree Correlation Summary
| Measurement | Bahamian | Uruguayan |
| Minimum | 1.5% | 6.5% |
| Maximum | 63.5% | 46.6% |
| Range | 61.9% | 40.1% |
| Mean | 26.7% | 29.5% |
| Median | 25.3% | 31.5% |
| Interquartile 25% (IQ1) | 17.8% | 17.7% |
| Interquartile 75% (IQ3) | 34.8% | 39.6% |
| Interquartile Range (IQR) | 17.0% | 21.9% |
| Standard Deviation (Sample) | 12.1% | 11.8% |
| Standard Deviation (Population) | 12.0% | 11.6% |
Similar Demographics by Bachelor's Degree
Demographics Similar to Bahamians by Bachelor's Degree
In terms of bachelor's degree, the demographic groups most similar to Bahamians are Central American Indian (32.5%, a difference of 0.030%), Immigrants from Dominica (32.5%, a difference of 0.030%), Cuban (32.5%, a difference of 0.15%), Belizean (32.8%, a difference of 0.81%), and Immigrants from Portugal (32.2%, a difference of 0.91%).
| Demographics | Rating | Rank | Bachelor's Degree |
| French American Indians | 0.6 /100 | #258 | Tragic 33.1% |
| Osage | 0.5 /100 | #259 | Tragic 33.0% |
| Malaysians | 0.5 /100 | #260 | Tragic 32.9% |
| Africans | 0.5 /100 | #261 | Tragic 32.9% |
| Immigrants | Jamaica | 0.5 /100 | #262 | Tragic 32.9% |
| Belizeans | 0.4 /100 | #263 | Tragic 32.8% |
| Central American Indians | 0.3 /100 | #264 | Tragic 32.5% |
| Bahamians | 0.3 /100 | #265 | Tragic 32.5% |
| Immigrants | Dominica | 0.3 /100 | #266 | Tragic 32.5% |
| Cubans | 0.3 /100 | #267 | Tragic 32.5% |
| Immigrants | Portugal | 0.2 /100 | #268 | Tragic 32.2% |
| Immigrants | Belize | 0.2 /100 | #269 | Tragic 32.1% |
| Immigrants | Nicaragua | 0.2 /100 | #270 | Tragic 31.9% |
| Central Americans | 0.2 /100 | #271 | Tragic 31.9% |
| Comanche | 0.2 /100 | #272 | Tragic 31.9% |
Demographics Similar to Uruguayans by Bachelor's Degree
In terms of bachelor's degree, the demographic groups most similar to Uruguayans are Vietnamese (38.5%, a difference of 0.080%), Colombian (38.4%, a difference of 0.080%), Chinese (38.5%, a difference of 0.090%), Peruvian (38.3%, a difference of 0.25%), and Hungarian (38.3%, a difference of 0.38%).
| Demographics | Rating | Rank | Bachelor's Degree |
| Canadians | 75.0 /100 | #154 | Good 38.8% |
| Immigrants | Kenya | 73.8 /100 | #155 | Good 38.8% |
| Kenyans | 72.5 /100 | #156 | Good 38.7% |
| Immigrants | South America | 70.1 /100 | #157 | Good 38.6% |
| Immigrants | Germany | 69.6 /100 | #158 | Good 38.6% |
| Chinese | 66.6 /100 | #159 | Good 38.5% |
| Vietnamese | 66.6 /100 | #160 | Good 38.5% |
| Uruguayans | 65.8 /100 | #161 | Good 38.4% |
| Colombians | 65.0 /100 | #162 | Good 38.4% |
| Peruvians | 63.4 /100 | #163 | Good 38.3% |
| Hungarians | 62.1 /100 | #164 | Good 38.3% |
| Sri Lankans | 59.1 /100 | #165 | Average 38.2% |
| Somalis | 58.6 /100 | #166 | Average 38.1% |
| Scottish | 56.6 /100 | #167 | Average 38.1% |
| Danes | 56.2 /100 | #168 | Average 38.1% |