Bahamian vs Finnish Bachelor's Degree
COMPARE
Bahamian
Finnish
Bachelor's Degree
Bachelor's Degree Comparison
Bahamians
Finns
32.5%
BACHELOR'S DEGREE
0.3/ 100
METRIC RATING
265th/ 347
METRIC RANK
36.7%
BACHELOR'S DEGREE
22.2/ 100
METRIC RATING
205th/ 347
METRIC RANK
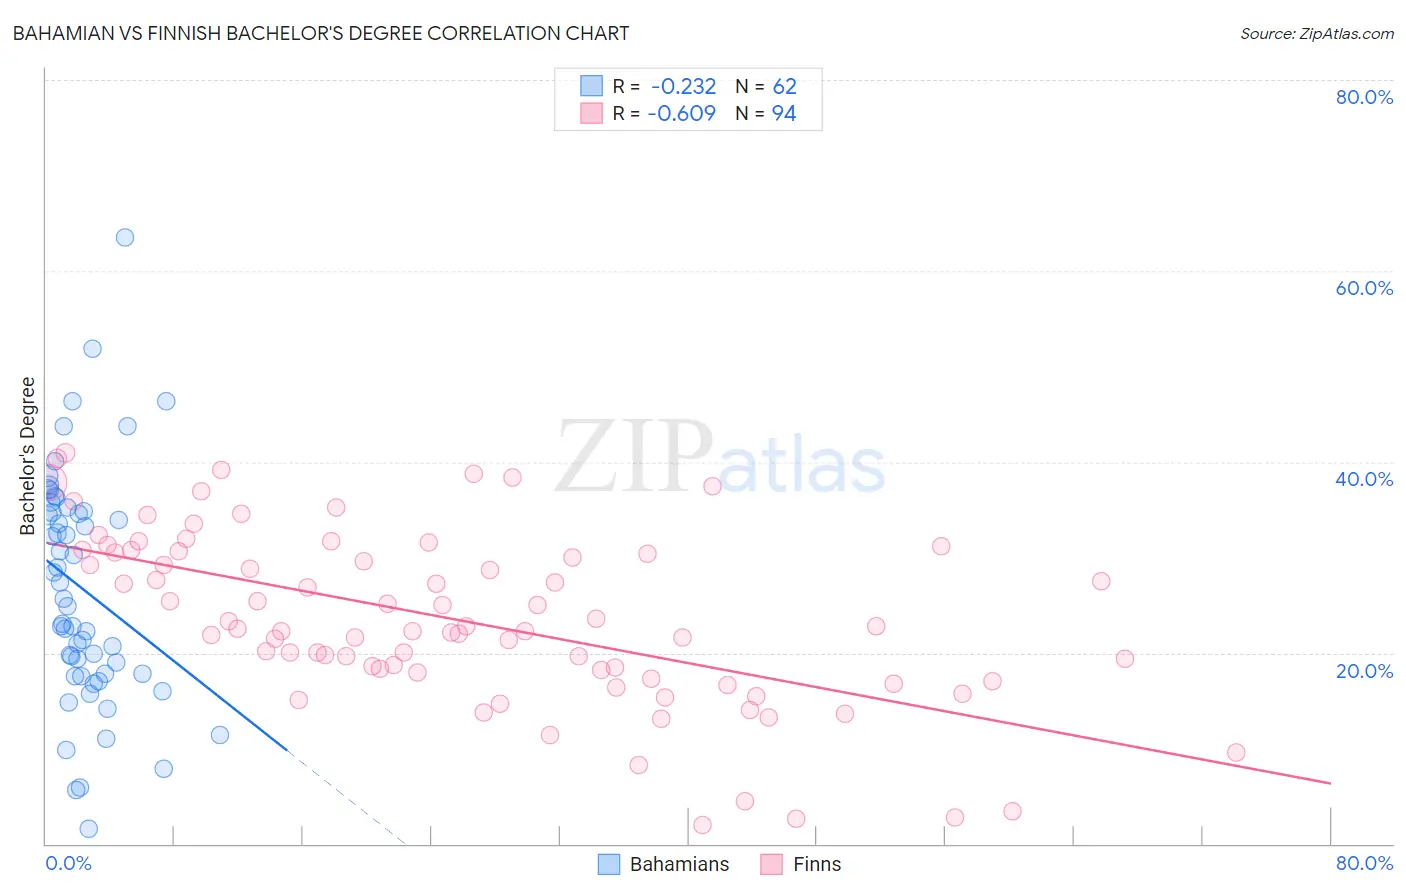
Bahamian vs Finnish Bachelor's Degree Correlation Chart
The statistical analysis conducted on geographies consisting of 112,698,493 people shows a weak negative correlation between the proportion of Bahamians and percentage of population with at least bachelor's degree education in the United States with a correlation coefficient (R) of -0.232 and weighted average of 32.5%. Similarly, the statistical analysis conducted on geographies consisting of 404,648,142 people shows a significant negative correlation between the proportion of Finns and percentage of population with at least bachelor's degree education in the United States with a correlation coefficient (R) of -0.609 and weighted average of 36.7%, a difference of 12.7%.
Bachelor's Degree Correlation Summary
| Measurement | Bahamian | Finnish |
| Minimum | 1.5% | 2.0% |
| Maximum | 63.5% | 40.9% |
| Range | 61.9% | 38.9% |
| Mean | 26.7% | 23.4% |
| Median | 25.3% | 22.4% |
| Interquartile 25% (IQ1) | 17.8% | 18.0% |
| Interquartile 75% (IQ3) | 34.8% | 30.5% |
| Interquartile Range (IQR) | 17.0% | 12.6% |
| Standard Deviation (Sample) | 12.1% | 9.0% |
| Standard Deviation (Population) | 12.0% | 9.0% |
Similar Demographics by Bachelor's Degree
Demographics Similar to Bahamians by Bachelor's Degree
In terms of bachelor's degree, the demographic groups most similar to Bahamians are Central American Indian (32.5%, a difference of 0.030%), Immigrants from Dominica (32.5%, a difference of 0.030%), Cuban (32.5%, a difference of 0.15%), Belizean (32.8%, a difference of 0.81%), and Immigrants from Portugal (32.2%, a difference of 0.91%).
| Demographics | Rating | Rank | Bachelor's Degree |
| French American Indians | 0.6 /100 | #258 | Tragic 33.1% |
| Osage | 0.5 /100 | #259 | Tragic 33.0% |
| Malaysians | 0.5 /100 | #260 | Tragic 32.9% |
| Africans | 0.5 /100 | #261 | Tragic 32.9% |
| Immigrants | Jamaica | 0.5 /100 | #262 | Tragic 32.9% |
| Belizeans | 0.4 /100 | #263 | Tragic 32.8% |
| Central American Indians | 0.3 /100 | #264 | Tragic 32.5% |
| Bahamians | 0.3 /100 | #265 | Tragic 32.5% |
| Immigrants | Dominica | 0.3 /100 | #266 | Tragic 32.5% |
| Cubans | 0.3 /100 | #267 | Tragic 32.5% |
| Immigrants | Portugal | 0.2 /100 | #268 | Tragic 32.2% |
| Immigrants | Belize | 0.2 /100 | #269 | Tragic 32.1% |
| Immigrants | Nicaragua | 0.2 /100 | #270 | Tragic 31.9% |
| Central Americans | 0.2 /100 | #271 | Tragic 31.9% |
| Comanche | 0.2 /100 | #272 | Tragic 31.9% |
Demographics Similar to Finns by Bachelor's Degree
In terms of bachelor's degree, the demographic groups most similar to Finns are Immigrants (36.7%, a difference of 0.10%), Immigrants from Nigeria (36.7%, a difference of 0.14%), Spaniard (36.6%, a difference of 0.14%), Immigrants from Middle Africa (36.6%, a difference of 0.23%), and Immigrants from Zaire (36.8%, a difference of 0.43%).
| Demographics | Rating | Rank | Bachelor's Degree |
| Welsh | 29.1 /100 | #198 | Fair 37.0% |
| Immigrants | Costa Rica | 27.4 /100 | #199 | Fair 36.9% |
| Immigrants | Ghana | 27.4 /100 | #200 | Fair 36.9% |
| Immigrants | South Eastern Asia | 25.4 /100 | #201 | Fair 36.8% |
| Immigrants | Zaire | 25.3 /100 | #202 | Fair 36.8% |
| Immigrants | Nigeria | 23.1 /100 | #203 | Fair 36.7% |
| Immigrants | Immigrants | 22.8 /100 | #204 | Fair 36.7% |
| Finns | 22.2 /100 | #205 | Fair 36.7% |
| Spaniards | 21.2 /100 | #206 | Fair 36.6% |
| Immigrants | Middle Africa | 20.6 /100 | #207 | Fair 36.6% |
| Immigrants | Thailand | 19.4 /100 | #208 | Poor 36.5% |
| Panamanians | 18.8 /100 | #209 | Poor 36.5% |
| French | 18.6 /100 | #210 | Poor 36.5% |
| Scotch-Irish | 18.3 /100 | #211 | Poor 36.4% |
| Immigrants | Philippines | 17.8 /100 | #212 | Poor 36.4% |