Bolivian vs Spanish 2nd Grade
COMPARE
Bolivian
Spanish
2nd Grade
2nd Grade Comparison
Bolivians
Spanish
97.5%
2ND GRADE
0.9/ 100
METRIC RATING
249th/ 347
METRIC RANK
98.1%
2ND GRADE
95.8/ 100
METRIC RATING
116th/ 347
METRIC RANK
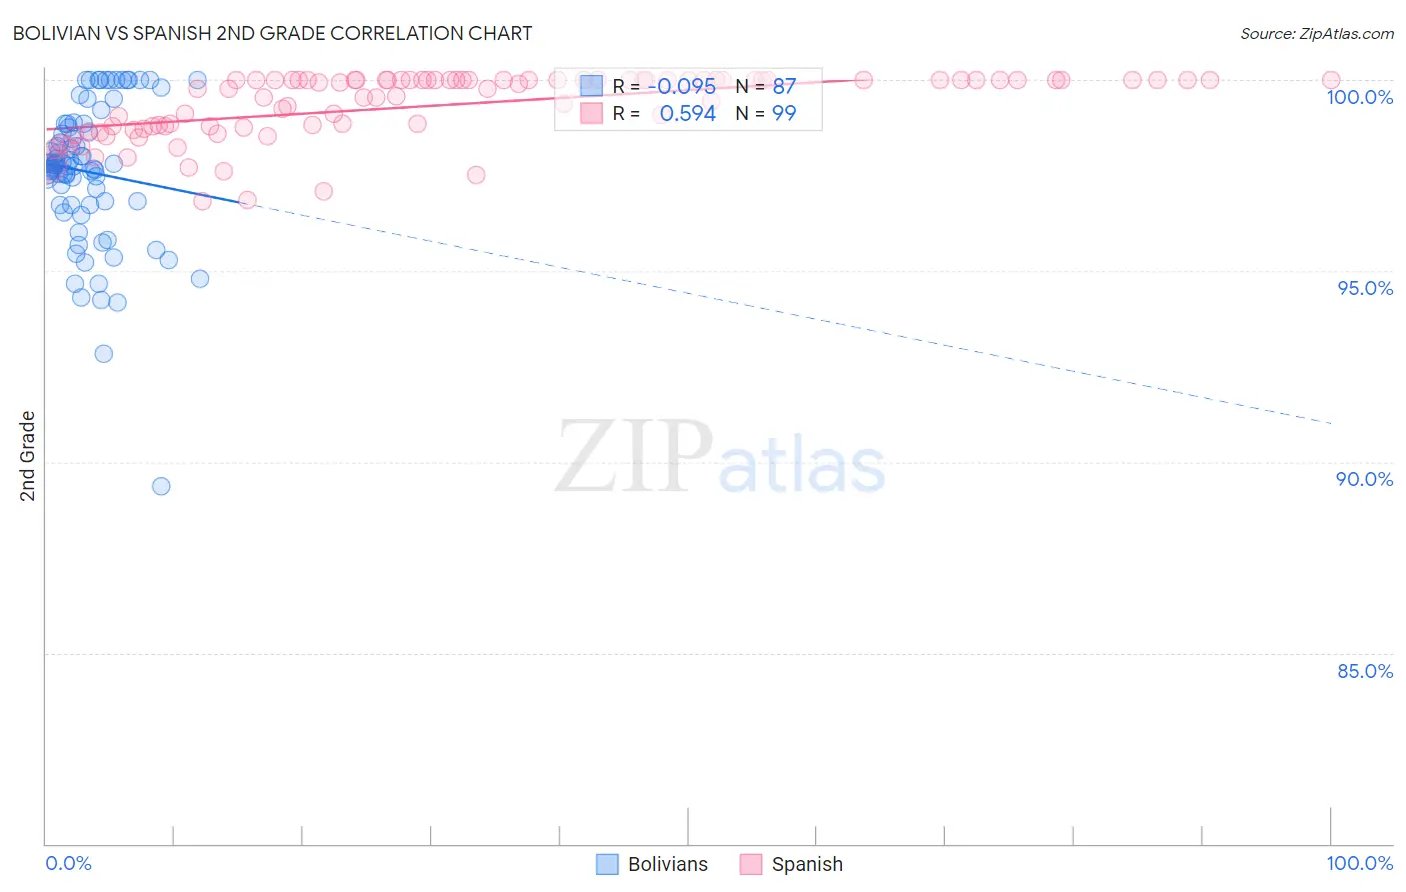
Bolivian vs Spanish 2nd Grade Correlation Chart
The statistical analysis conducted on geographies consisting of 184,667,361 people shows a slight negative correlation between the proportion of Bolivians and percentage of population with at least 2nd grade education in the United States with a correlation coefficient (R) of -0.095 and weighted average of 97.5%. Similarly, the statistical analysis conducted on geographies consisting of 422,189,210 people shows a substantial positive correlation between the proportion of Spanish and percentage of population with at least 2nd grade education in the United States with a correlation coefficient (R) of 0.594 and weighted average of 98.1%, a difference of 0.62%.
2nd Grade Correlation Summary
| Measurement | Bolivian | Spanish |
| Minimum | 89.3% | 96.8% |
| Maximum | 100.0% | 100.0% |
| Range | 10.7% | 3.2% |
| Mean | 97.6% | 99.3% |
| Median | 97.8% | 99.9% |
| Interquartile 25% (IQ1) | 96.7% | 98.8% |
| Interquartile 75% (IQ3) | 98.8% | 100.0% |
| Interquartile Range (IQR) | 2.1% | 1.2% |
| Standard Deviation (Sample) | 1.9% | 0.84% |
| Standard Deviation (Population) | 1.9% | 0.84% |
Similar Demographics by 2nd Grade
Demographics Similar to Bolivians by 2nd Grade
In terms of 2nd grade, the demographic groups most similar to Bolivians are South American (97.5%, a difference of 0.0%), Immigrants from Senegal (97.5%, a difference of 0.0%), Immigrants from Middle Africa (97.5%, a difference of 0.0%), Peruvian (97.5%, a difference of 0.0%), and Immigrants from Iraq (97.5%, a difference of 0.010%).
| Demographics | Rating | Rank | 2nd Grade |
| Immigrants | Indonesia | 1.2 /100 | #242 | Tragic 97.5% |
| Asians | 1.1 /100 | #243 | Tragic 97.5% |
| Immigrants | Iraq | 1.0 /100 | #244 | Tragic 97.5% |
| Immigrants | Eastern Africa | 0.9 /100 | #245 | Tragic 97.5% |
| South Americans | 0.9 /100 | #246 | Tragic 97.5% |
| Immigrants | Senegal | 0.9 /100 | #247 | Tragic 97.5% |
| Immigrants | Middle Africa | 0.9 /100 | #248 | Tragic 97.5% |
| Bolivians | 0.9 /100 | #249 | Tragic 97.5% |
| Peruvians | 0.9 /100 | #250 | Tragic 97.5% |
| Immigrants | Africa | 0.8 /100 | #251 | Tragic 97.5% |
| Immigrants | Asia | 0.7 /100 | #252 | Tragic 97.5% |
| Puerto Ricans | 0.7 /100 | #253 | Tragic 97.5% |
| Indians (Asian) | 0.6 /100 | #254 | Tragic 97.5% |
| Immigrants | Congo | 0.6 /100 | #255 | Tragic 97.5% |
| Jamaicans | 0.6 /100 | #256 | Tragic 97.5% |
Demographics Similar to Spanish by 2nd Grade
In terms of 2nd grade, the demographic groups most similar to Spanish are Iranian (98.1%, a difference of 0.0%), Ute (98.1%, a difference of 0.0%), Immigrants from France (98.1%, a difference of 0.0%), Immigrants from Latvia (98.1%, a difference of 0.010%), and Thai (98.1%, a difference of 0.010%).
| Demographics | Rating | Rank | 2nd Grade |
| Basques | 97.2 /100 | #109 | Exceptional 98.1% |
| Immigrants | Singapore | 97.0 /100 | #110 | Exceptional 98.1% |
| Immigrants | Czechoslovakia | 96.9 /100 | #111 | Exceptional 98.1% |
| Colville | 96.6 /100 | #112 | Exceptional 98.1% |
| Immigrants | Norway | 96.5 /100 | #113 | Exceptional 98.1% |
| Immigrants | Latvia | 96.4 /100 | #114 | Exceptional 98.1% |
| Iranians | 95.9 /100 | #115 | Exceptional 98.1% |
| Spanish | 95.8 /100 | #116 | Exceptional 98.1% |
| Ute | 95.7 /100 | #117 | Exceptional 98.1% |
| Immigrants | France | 95.6 /100 | #118 | Exceptional 98.1% |
| Thais | 95.3 /100 | #119 | Exceptional 98.1% |
| Okinawans | 94.9 /100 | #120 | Exceptional 98.1% |
| Immigrants | Zimbabwe | 94.4 /100 | #121 | Exceptional 98.1% |
| Lebanese | 94.2 /100 | #122 | Exceptional 98.1% |
| Immigrants | Japan | 94.1 /100 | #123 | Exceptional 98.1% |