Immigrants from Philippines vs Immigrants from Fiji 12th Grade, No Diploma
COMPARE
Immigrants from Philippines
Immigrants from Fiji
12th Grade, No Diploma
12th Grade, No Diploma Comparison
Immigrants from Philippines
Immigrants from Fiji
90.2%
12TH GRADE, NO DIPLOMA
2.8/ 100
METRIC RATING
230th/ 347
METRIC RANK
88.6%
12TH GRADE, NO DIPLOMA
0.0/ 100
METRIC RATING
288th/ 347
METRIC RANK
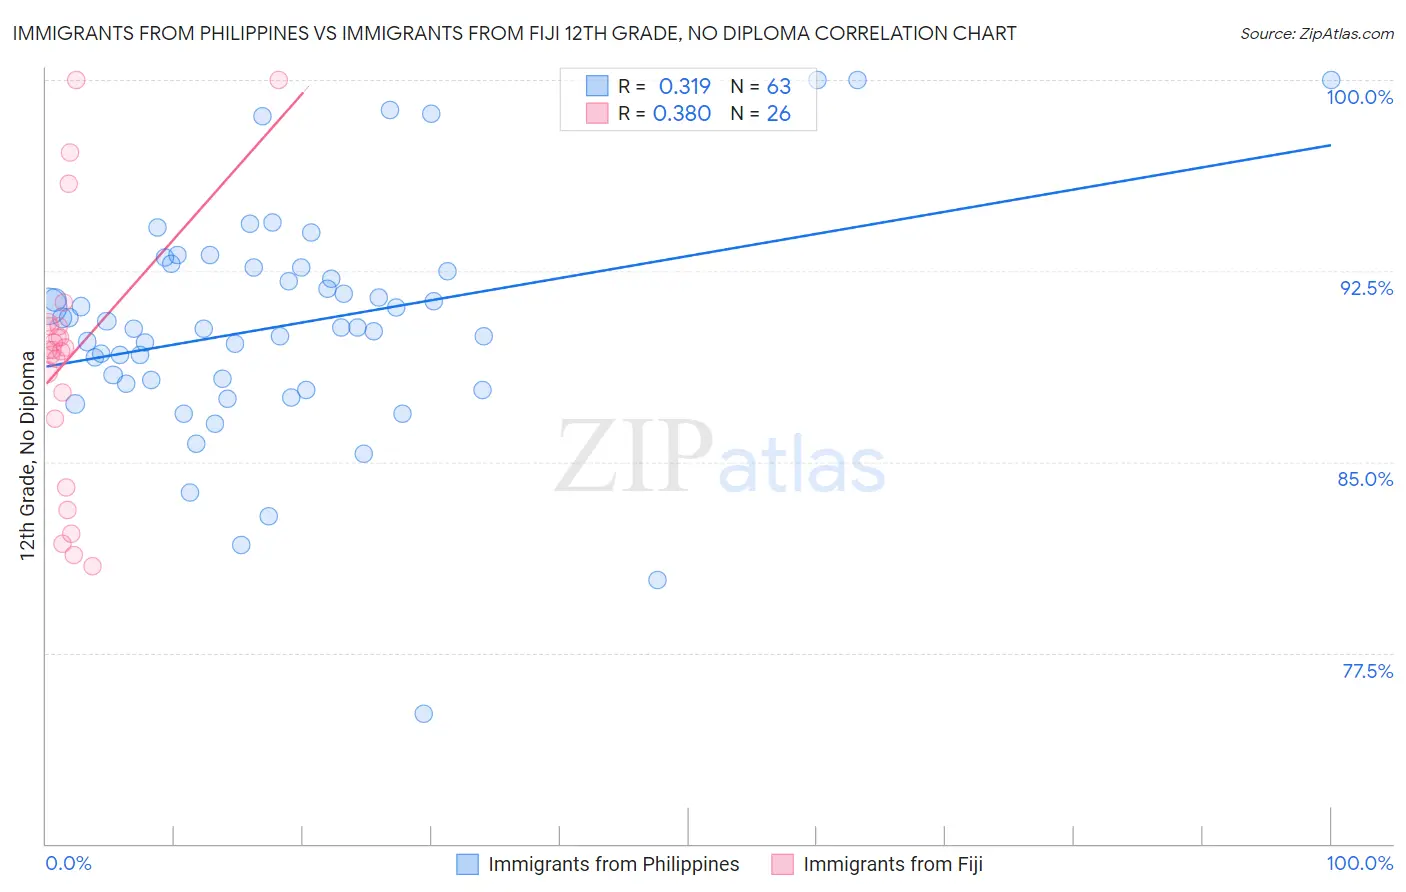
Immigrants from Philippines vs Immigrants from Fiji 12th Grade, No Diploma Correlation Chart
The statistical analysis conducted on geographies consisting of 471,300,535 people shows a mild positive correlation between the proportion of Immigrants from Philippines and percentage of population with at least 12th grade (no diploma) education in the United States with a correlation coefficient (R) of 0.319 and weighted average of 90.2%. Similarly, the statistical analysis conducted on geographies consisting of 93,756,204 people shows a mild positive correlation between the proportion of Immigrants from Fiji and percentage of population with at least 12th grade (no diploma) education in the United States with a correlation coefficient (R) of 0.380 and weighted average of 88.6%, a difference of 1.7%.
12th Grade, No Diploma Correlation Summary
| Measurement | Immigrants from Philippines | Immigrants from Fiji |
| Minimum | 75.1% | 80.9% |
| Maximum | 100.0% | 100.0% |
| Range | 24.9% | 19.1% |
| Mean | 90.4% | 89.1% |
| Median | 90.3% | 89.4% |
| Interquartile 25% (IQ1) | 88.1% | 86.7% |
| Interquartile 75% (IQ3) | 92.6% | 90.3% |
| Interquartile Range (IQR) | 4.6% | 3.6% |
| Standard Deviation (Sample) | 4.5% | 5.1% |
| Standard Deviation (Population) | 4.5% | 5.0% |
Similar Demographics by 12th Grade, No Diploma
Demographics Similar to Immigrants from Philippines by 12th Grade, No Diploma
In terms of 12th grade, no diploma, the demographic groups most similar to Immigrants from Philippines are Peruvian (90.2%, a difference of 0.010%), Blackfeet (90.1%, a difference of 0.050%), Immigrants from Thailand (90.1%, a difference of 0.070%), Immigrants from South America (90.1%, a difference of 0.070%), and Colville (90.1%, a difference of 0.070%).
| Demographics | Rating | Rank | 12th Grade, No Diploma |
| South Americans | 5.0 /100 | #223 | Tragic 90.3% |
| Immigrants | Panama | 4.8 /100 | #224 | Tragic 90.3% |
| Chickasaw | 4.8 /100 | #225 | Tragic 90.3% |
| Immigrants | Zaire | 4.6 /100 | #226 | Tragic 90.3% |
| Nigerians | 4.5 /100 | #227 | Tragic 90.3% |
| Creek | 3.9 /100 | #228 | Tragic 90.3% |
| Immigrants | Bahamas | 3.6 /100 | #229 | Tragic 90.2% |
| Immigrants | Philippines | 2.8 /100 | #230 | Tragic 90.2% |
| Peruvians | 2.7 /100 | #231 | Tragic 90.2% |
| Blackfeet | 2.4 /100 | #232 | Tragic 90.1% |
| Immigrants | Thailand | 2.3 /100 | #233 | Tragic 90.1% |
| Immigrants | South America | 2.3 /100 | #234 | Tragic 90.1% |
| Colville | 2.3 /100 | #235 | Tragic 90.1% |
| Immigrants | Uzbekistan | 2.2 /100 | #236 | Tragic 90.1% |
| Immigrants | Colombia | 2.1 /100 | #237 | Tragic 90.1% |
Demographics Similar to Immigrants from Fiji by 12th Grade, No Diploma
In terms of 12th grade, no diploma, the demographic groups most similar to Immigrants from Fiji are Hopi (88.6%, a difference of 0.0%), Indonesian (88.6%, a difference of 0.010%), Immigrants from West Indies (88.6%, a difference of 0.010%), Pennsylvania German (88.7%, a difference of 0.030%), and Paiute (88.7%, a difference of 0.040%).
| Demographics | Rating | Rank | 12th Grade, No Diploma |
| Cubans | 0.0 /100 | #281 | Tragic 88.9% |
| Immigrants | Vietnam | 0.0 /100 | #282 | Tragic 88.7% |
| Paiute | 0.0 /100 | #283 | Tragic 88.7% |
| Pennsylvania Germans | 0.0 /100 | #284 | Tragic 88.7% |
| Indonesians | 0.0 /100 | #285 | Tragic 88.6% |
| Immigrants | West Indies | 0.0 /100 | #286 | Tragic 88.6% |
| Hopi | 0.0 /100 | #287 | Tragic 88.6% |
| Immigrants | Fiji | 0.0 /100 | #288 | Tragic 88.6% |
| Dutch West Indians | 0.0 /100 | #289 | Tragic 88.5% |
| British West Indians | 0.0 /100 | #290 | Tragic 88.5% |
| Haitians | 0.0 /100 | #291 | Tragic 88.5% |
| Immigrants | Grenada | 0.0 /100 | #292 | Tragic 88.4% |
| Japanese | 0.0 /100 | #293 | Tragic 88.3% |
| Guyanese | 0.0 /100 | #294 | Tragic 88.3% |
| Immigrants | Immigrants | 0.0 /100 | #295 | Tragic 88.2% |