Burmese vs Cree 12th Grade, No Diploma
COMPARE
Burmese
Cree
12th Grade, No Diploma
12th Grade, No Diploma Comparison
Burmese
Cree
92.6%
12TH GRADE, NO DIPLOMA
99.4/ 100
METRIC RATING
73rd/ 347
METRIC RANK
91.2%
12TH GRADE, NO DIPLOMA
57.0/ 100
METRIC RATING
168th/ 347
METRIC RANK
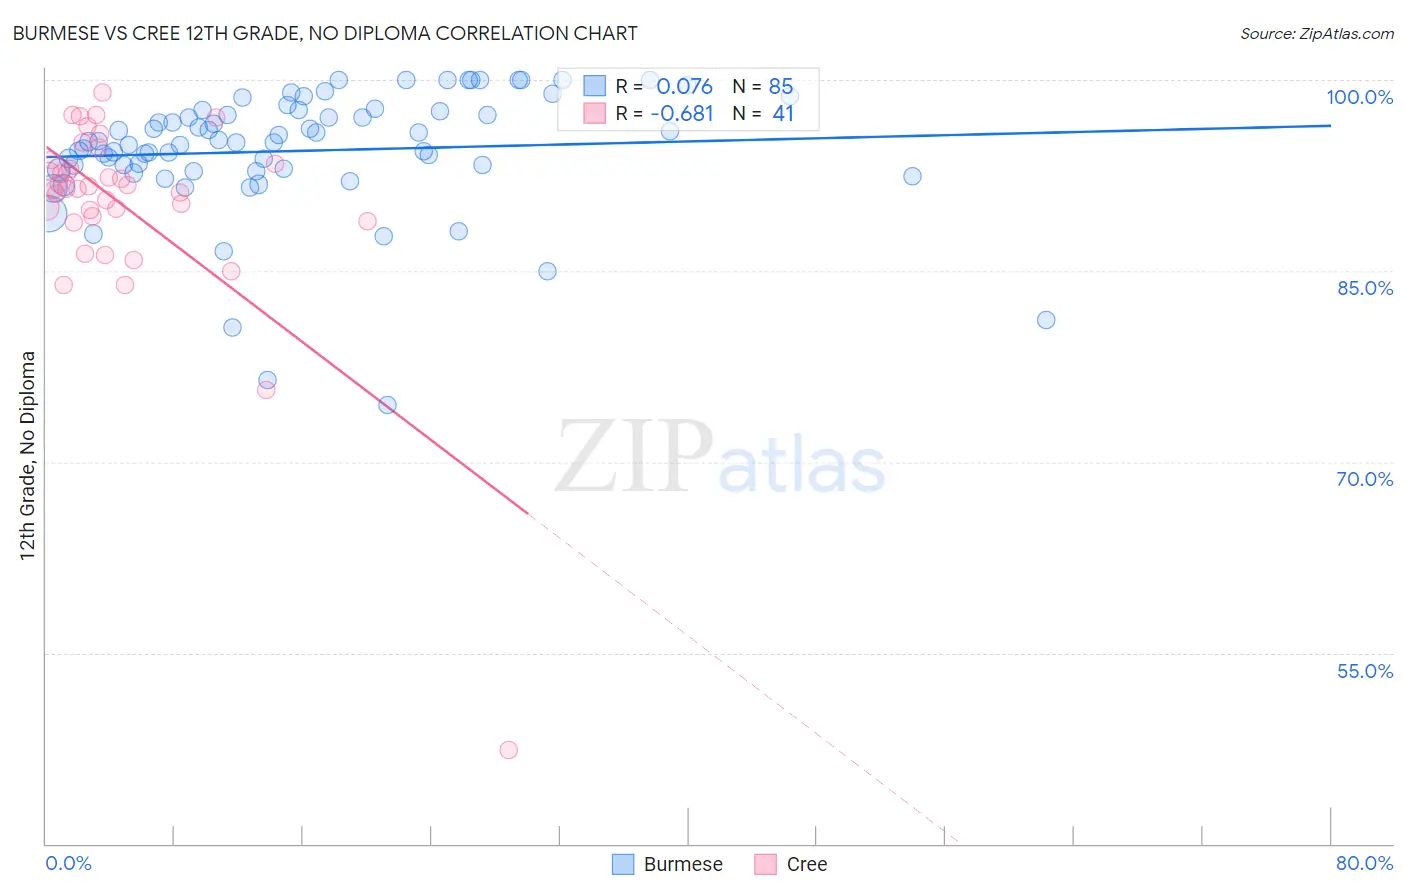
Burmese vs Cree 12th Grade, No Diploma Correlation Chart
The statistical analysis conducted on geographies consisting of 465,370,486 people shows a slight positive correlation between the proportion of Burmese and percentage of population with at least 12th grade (no diploma) education in the United States with a correlation coefficient (R) of 0.076 and weighted average of 92.6%. Similarly, the statistical analysis conducted on geographies consisting of 76,211,744 people shows a significant negative correlation between the proportion of Cree and percentage of population with at least 12th grade (no diploma) education in the United States with a correlation coefficient (R) of -0.681 and weighted average of 91.2%, a difference of 1.5%.
12th Grade, No Diploma Correlation Summary
| Measurement | Burmese | Cree |
| Minimum | 74.5% | 47.4% |
| Maximum | 100.0% | 99.0% |
| Range | 25.5% | 51.6% |
| Mean | 94.4% | 90.2% |
| Median | 95.1% | 91.5% |
| Interquartile 25% (IQ1) | 92.9% | 89.1% |
| Interquartile 75% (IQ3) | 97.6% | 93.6% |
| Interquartile Range (IQR) | 4.7% | 4.5% |
| Standard Deviation (Sample) | 4.9% | 8.2% |
| Standard Deviation (Population) | 4.9% | 8.1% |
Similar Demographics by 12th Grade, No Diploma
Demographics Similar to Burmese by 12th Grade, No Diploma
In terms of 12th grade, no diploma, the demographic groups most similar to Burmese are Immigrants from Moldova (92.6%, a difference of 0.0%), Native Hawaiian (92.6%, a difference of 0.0%), Immigrants from South Central Asia (92.6%, a difference of 0.010%), French (92.6%, a difference of 0.010%), and Immigrants from England (92.6%, a difference of 0.020%).
| Demographics | Rating | Rank | 12th Grade, No Diploma |
| Soviet Union | 99.6 /100 | #66 | Exceptional 92.7% |
| Immigrants | South Africa | 99.5 /100 | #67 | Exceptional 92.7% |
| Immigrants | Czechoslovakia | 99.5 /100 | #68 | Exceptional 92.7% |
| Immigrants | Iran | 99.5 /100 | #69 | Exceptional 92.7% |
| Czechoslovakians | 99.5 /100 | #70 | Exceptional 92.6% |
| Immigrants | Latvia | 99.5 /100 | #71 | Exceptional 92.6% |
| Immigrants | South Central Asia | 99.5 /100 | #72 | Exceptional 92.6% |
| Burmese | 99.4 /100 | #73 | Exceptional 92.6% |
| Immigrants | Moldova | 99.4 /100 | #74 | Exceptional 92.6% |
| Native Hawaiians | 99.4 /100 | #75 | Exceptional 92.6% |
| French | 99.4 /100 | #76 | Exceptional 92.6% |
| Immigrants | England | 99.4 /100 | #77 | Exceptional 92.6% |
| Cambodians | 99.3 /100 | #78 | Exceptional 92.6% |
| Romanians | 99.3 /100 | #79 | Exceptional 92.6% |
| French Canadians | 99.3 /100 | #80 | Exceptional 92.6% |
Demographics Similar to Cree by 12th Grade, No Diploma
In terms of 12th grade, no diploma, the demographic groups most similar to Cree are Hmong (91.3%, a difference of 0.010%), Immigrants from Malaysia (91.3%, a difference of 0.010%), Alsatian (91.3%, a difference of 0.020%), Immigrants from Indonesia (91.2%, a difference of 0.030%), and Immigrants from China (91.3%, a difference of 0.050%).
| Demographics | Rating | Rank | 12th Grade, No Diploma |
| Immigrants | Hong Kong | 63.8 /100 | #161 | Good 91.3% |
| Brazilians | 62.0 /100 | #162 | Good 91.3% |
| Immigrants | Asia | 61.5 /100 | #163 | Good 91.3% |
| Immigrants | China | 60.9 /100 | #164 | Good 91.3% |
| Alsatians | 58.3 /100 | #165 | Average 91.3% |
| Hmong | 58.0 /100 | #166 | Average 91.3% |
| Immigrants | Malaysia | 57.8 /100 | #167 | Average 91.3% |
| Cree | 57.0 /100 | #168 | Average 91.2% |
| Immigrants | Indonesia | 54.9 /100 | #169 | Average 91.2% |
| Delaware | 52.8 /100 | #170 | Average 91.2% |
| Immigrants | Morocco | 51.4 /100 | #171 | Average 91.2% |
| Bermudans | 50.8 /100 | #172 | Average 91.2% |
| Bolivians | 50.4 /100 | #173 | Average 91.2% |
| Immigrants | Nepal | 50.0 /100 | #174 | Average 91.2% |
| Immigrants | Western Asia | 49.0 /100 | #175 | Average 91.2% |