Assyrian/Chaldean/Syriac vs Cherokee College, Under 1 year
COMPARE
Assyrian/Chaldean/Syriac
Cherokee
College, Under 1 year
College, Under 1 year Comparison
Assyrians/Chaldeans/Syriacs
Cherokee
67.7%
COLLEGE, UNDER 1 YEAR
95.8/ 100
METRIC RATING
110th/ 347
METRIC RANK
60.1%
COLLEGE, UNDER 1 YEAR
0.1/ 100
METRIC RATING
281st/ 347
METRIC RANK
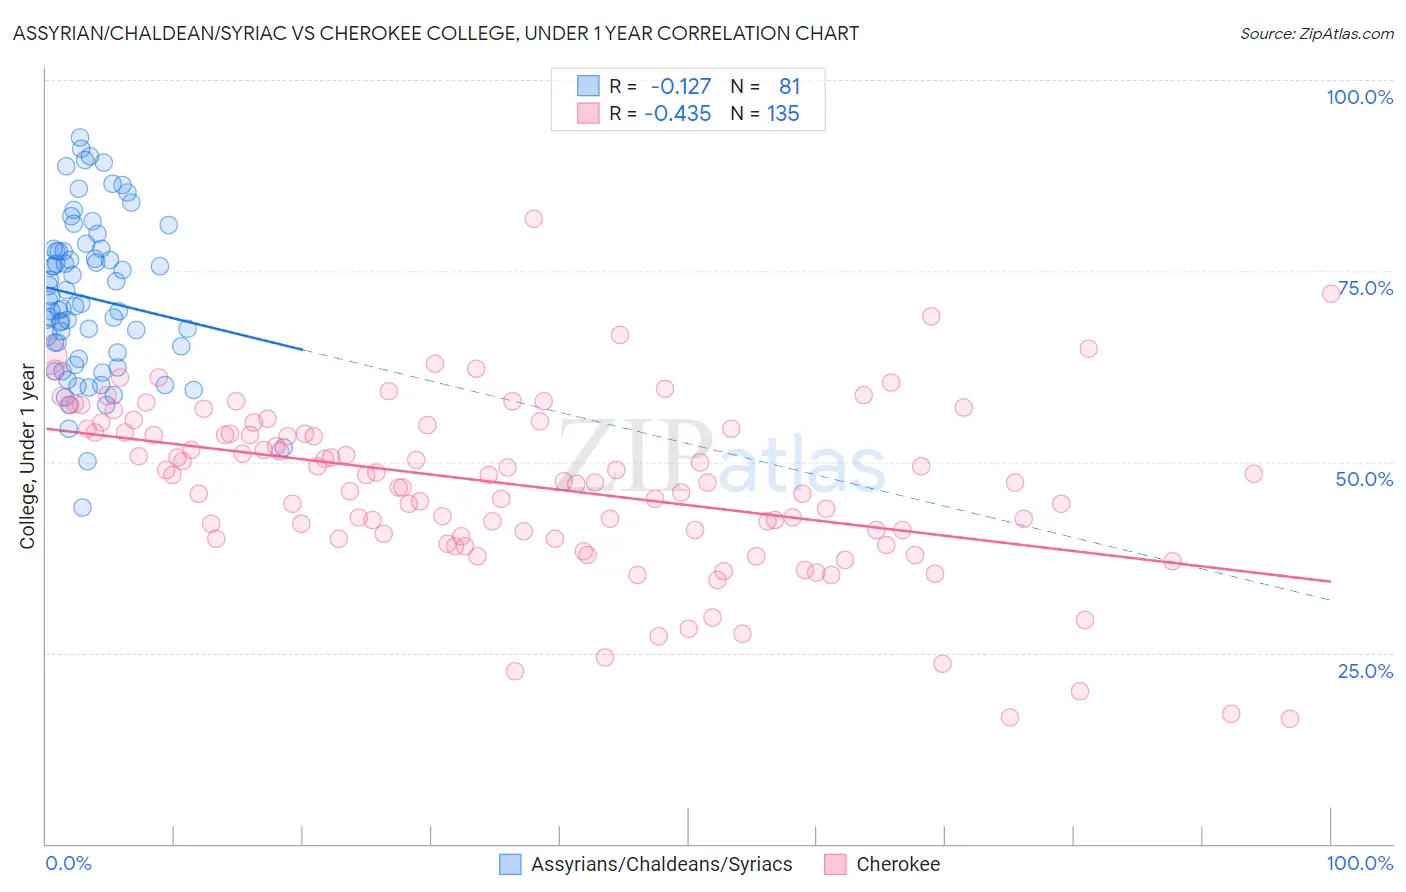
Assyrian/Chaldean/Syriac vs Cherokee College, Under 1 year Correlation Chart
The statistical analysis conducted on geographies consisting of 110,318,304 people shows a poor negative correlation between the proportion of Assyrians/Chaldeans/Syriacs and percentage of population with at least college, under 1 year education in the United States with a correlation coefficient (R) of -0.127 and weighted average of 67.7%. Similarly, the statistical analysis conducted on geographies consisting of 493,717,865 people shows a moderate negative correlation between the proportion of Cherokee and percentage of population with at least college, under 1 year education in the United States with a correlation coefficient (R) of -0.435 and weighted average of 60.1%, a difference of 12.6%.
College, Under 1 year Correlation Summary
| Measurement | Assyrian/Chaldean/Syriac | Cherokee |
| Minimum | 44.0% | 16.3% |
| Maximum | 92.5% | 81.8% |
| Range | 48.5% | 65.5% |
| Mean | 71.5% | 46.9% |
| Median | 70.8% | 47.4% |
| Interquartile 25% (IQ1) | 63.9% | 40.3% |
| Interquartile 75% (IQ3) | 77.8% | 54.4% |
| Interquartile Range (IQR) | 13.9% | 14.2% |
| Standard Deviation (Sample) | 10.2% | 11.2% |
| Standard Deviation (Population) | 10.2% | 11.2% |
Similar Demographics by College, Under 1 year
Demographics Similar to Assyrians/Chaldeans/Syriacs by College, Under 1 year
In terms of college, under 1 year, the demographic groups most similar to Assyrians/Chaldeans/Syriacs are Scandinavian (67.7%, a difference of 0.0%), Ukrainian (67.7%, a difference of 0.0%), Macedonian (67.6%, a difference of 0.020%), Syrian (67.6%, a difference of 0.040%), and Immigrants from Egypt (67.7%, a difference of 0.060%).
| Demographics | Rating | Rank | College, Under 1 year |
| Carpatho Rusyns | 96.8 /100 | #103 | Exceptional 67.9% |
| Immigrants | Western Asia | 96.6 /100 | #104 | Exceptional 67.8% |
| Afghans | 96.6 /100 | #105 | Exceptional 67.8% |
| Immigrants | Croatia | 96.6 /100 | #106 | Exceptional 67.8% |
| Austrians | 96.4 /100 | #107 | Exceptional 67.8% |
| Immigrants | Egypt | 96.0 /100 | #108 | Exceptional 67.7% |
| Scandinavians | 95.8 /100 | #109 | Exceptional 67.7% |
| Assyrians/Chaldeans/Syriacs | 95.8 /100 | #110 | Exceptional 67.7% |
| Ukrainians | 95.8 /100 | #111 | Exceptional 67.7% |
| Macedonians | 95.7 /100 | #112 | Exceptional 67.6% |
| Syrians | 95.6 /100 | #113 | Exceptional 67.6% |
| Chileans | 95.3 /100 | #114 | Exceptional 67.6% |
| Basques | 95.2 /100 | #115 | Exceptional 67.6% |
| Immigrants | Nepal | 94.9 /100 | #116 | Exceptional 67.5% |
| Pakistanis | 94.8 /100 | #117 | Exceptional 67.5% |
Demographics Similar to Cherokee by College, Under 1 year
In terms of college, under 1 year, the demographic groups most similar to Cherokee are Belizean (60.1%, a difference of 0.040%), Crow (60.2%, a difference of 0.11%), Ute (60.2%, a difference of 0.20%), Yaqui (60.2%, a difference of 0.21%), and Bahamian (60.3%, a difference of 0.25%).
| Demographics | Rating | Rank | College, Under 1 year |
| Alaska Natives | 0.1 /100 | #274 | Tragic 60.4% |
| Immigrants | Barbados | 0.1 /100 | #275 | Tragic 60.4% |
| Arapaho | 0.1 /100 | #276 | Tragic 60.3% |
| Bahamians | 0.1 /100 | #277 | Tragic 60.3% |
| Yaqui | 0.1 /100 | #278 | Tragic 60.2% |
| Ute | 0.1 /100 | #279 | Tragic 60.2% |
| Crow | 0.1 /100 | #280 | Tragic 60.2% |
| Cherokee | 0.1 /100 | #281 | Tragic 60.1% |
| Belizeans | 0.1 /100 | #282 | Tragic 60.1% |
| Immigrants | Jamaica | 0.0 /100 | #283 | Tragic 59.7% |
| Immigrants | St. Vincent and the Grenadines | 0.0 /100 | #284 | Tragic 59.6% |
| Paiute | 0.0 /100 | #285 | Tragic 59.6% |
| British West Indians | 0.0 /100 | #286 | Tragic 59.5% |
| Sioux | 0.0 /100 | #287 | Tragic 59.4% |
| Blacks/African Americans | 0.0 /100 | #288 | Tragic 59.4% |