Assyrian/Chaldean/Syriac vs Ethiopian College, Under 1 year
COMPARE
Assyrian/Chaldean/Syriac
Ethiopian
College, Under 1 year
College, Under 1 year Comparison
Assyrians/Chaldeans/Syriacs
Ethiopians
67.7%
COLLEGE, UNDER 1 YEAR
95.8/ 100
METRIC RATING
110th/ 347
METRIC RANK
68.3%
COLLEGE, UNDER 1 YEAR
98.2/ 100
METRIC RATING
89th/ 347
METRIC RANK
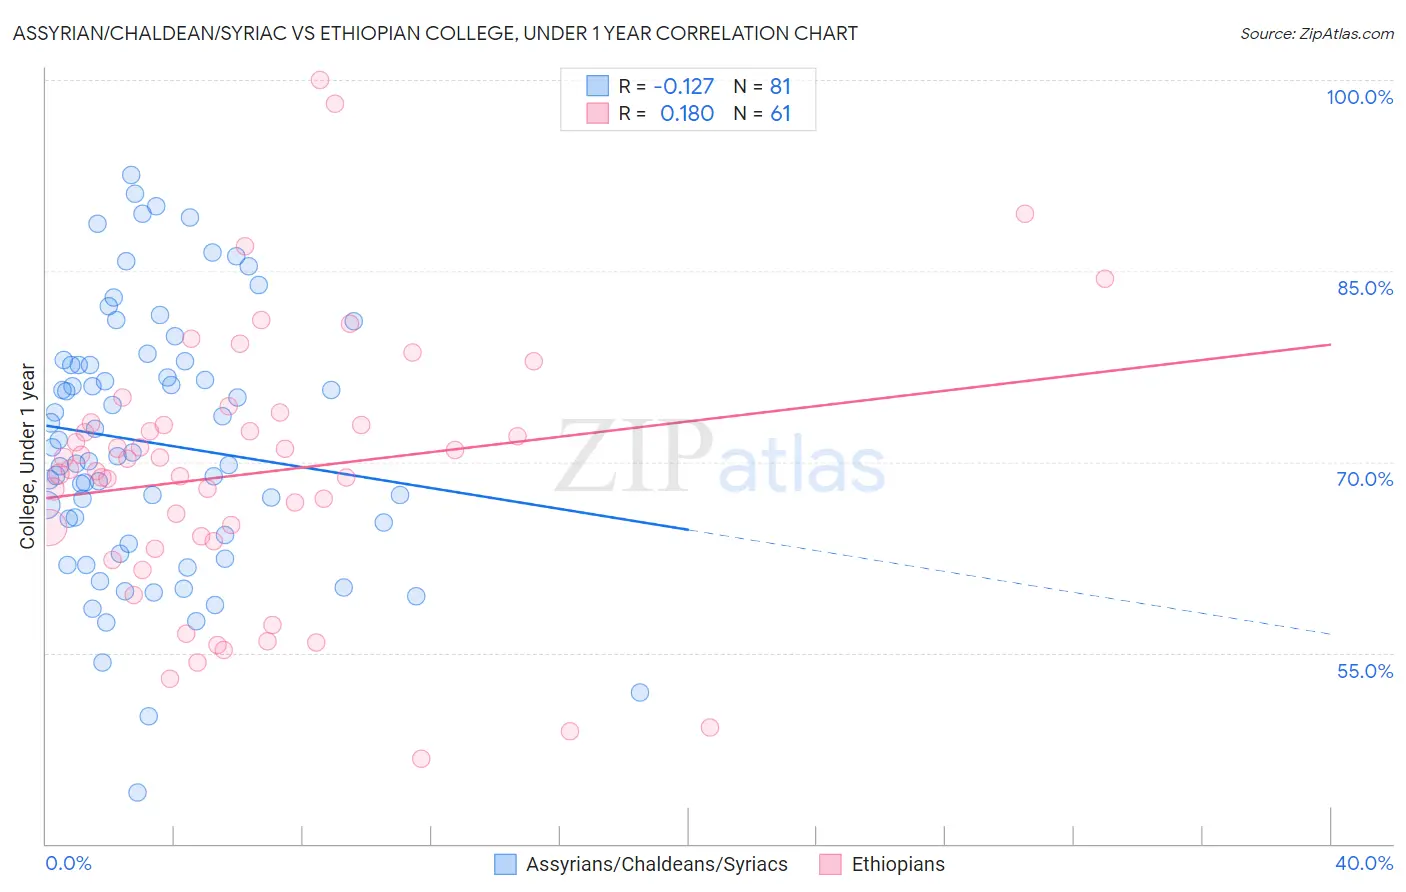
Assyrian/Chaldean/Syriac vs Ethiopian College, Under 1 year Correlation Chart
The statistical analysis conducted on geographies consisting of 110,318,304 people shows a poor negative correlation between the proportion of Assyrians/Chaldeans/Syriacs and percentage of population with at least college, under 1 year education in the United States with a correlation coefficient (R) of -0.127 and weighted average of 67.7%. Similarly, the statistical analysis conducted on geographies consisting of 223,260,030 people shows a poor positive correlation between the proportion of Ethiopians and percentage of population with at least college, under 1 year education in the United States with a correlation coefficient (R) of 0.180 and weighted average of 68.3%, a difference of 0.96%.
College, Under 1 year Correlation Summary
| Measurement | Assyrian/Chaldean/Syriac | Ethiopian |
| Minimum | 44.0% | 46.6% |
| Maximum | 92.5% | 100.0% |
| Range | 48.5% | 53.4% |
| Mean | 71.5% | 69.1% |
| Median | 70.8% | 69.4% |
| Interquartile 25% (IQ1) | 63.9% | 63.5% |
| Interquartile 75% (IQ3) | 77.8% | 73.0% |
| Interquartile Range (IQR) | 13.9% | 9.5% |
| Standard Deviation (Sample) | 10.2% | 10.6% |
| Standard Deviation (Population) | 10.2% | 10.6% |
Similar Demographics by College, Under 1 year
Demographics Similar to Assyrians/Chaldeans/Syriacs by College, Under 1 year
In terms of college, under 1 year, the demographic groups most similar to Assyrians/Chaldeans/Syriacs are Scandinavian (67.7%, a difference of 0.0%), Ukrainian (67.7%, a difference of 0.0%), Macedonian (67.6%, a difference of 0.020%), Syrian (67.6%, a difference of 0.040%), and Immigrants from Egypt (67.7%, a difference of 0.060%).
| Demographics | Rating | Rank | College, Under 1 year |
| Carpatho Rusyns | 96.8 /100 | #103 | Exceptional 67.9% |
| Immigrants | Western Asia | 96.6 /100 | #104 | Exceptional 67.8% |
| Afghans | 96.6 /100 | #105 | Exceptional 67.8% |
| Immigrants | Croatia | 96.6 /100 | #106 | Exceptional 67.8% |
| Austrians | 96.4 /100 | #107 | Exceptional 67.8% |
| Immigrants | Egypt | 96.0 /100 | #108 | Exceptional 67.7% |
| Scandinavians | 95.8 /100 | #109 | Exceptional 67.7% |
| Assyrians/Chaldeans/Syriacs | 95.8 /100 | #110 | Exceptional 67.7% |
| Ukrainians | 95.8 /100 | #111 | Exceptional 67.7% |
| Macedonians | 95.7 /100 | #112 | Exceptional 67.6% |
| Syrians | 95.6 /100 | #113 | Exceptional 67.6% |
| Chileans | 95.3 /100 | #114 | Exceptional 67.6% |
| Basques | 95.2 /100 | #115 | Exceptional 67.6% |
| Immigrants | Nepal | 94.9 /100 | #116 | Exceptional 67.5% |
| Pakistanis | 94.8 /100 | #117 | Exceptional 67.5% |
Demographics Similar to Ethiopians by College, Under 1 year
In terms of college, under 1 year, the demographic groups most similar to Ethiopians are Croatian (68.3%, a difference of 0.010%), Chinese (68.3%, a difference of 0.030%), Immigrants from Lebanon (68.3%, a difference of 0.050%), Immigrants from Hungary (68.3%, a difference of 0.060%), and Egyptian (68.3%, a difference of 0.060%).
| Demographics | Rating | Rank | College, Under 1 year |
| Norwegians | 98.4 /100 | #82 | Exceptional 68.4% |
| Argentineans | 98.4 /100 | #83 | Exceptional 68.4% |
| Immigrants | Hungary | 98.3 /100 | #84 | Exceptional 68.3% |
| Egyptians | 98.3 /100 | #85 | Exceptional 68.3% |
| Immigrants | Lebanon | 98.3 /100 | #86 | Exceptional 68.3% |
| Chinese | 98.3 /100 | #87 | Exceptional 68.3% |
| Croatians | 98.2 /100 | #88 | Exceptional 68.3% |
| Ethiopians | 98.2 /100 | #89 | Exceptional 68.3% |
| Icelanders | 98.1 /100 | #90 | Exceptional 68.3% |
| Europeans | 98.1 /100 | #91 | Exceptional 68.2% |
| Luxembourgers | 98.1 /100 | #92 | Exceptional 68.2% |
| Romanians | 97.9 /100 | #93 | Exceptional 68.2% |
| Armenians | 97.7 /100 | #94 | Exceptional 68.1% |
| Immigrants | Pakistan | 97.5 /100 | #95 | Exceptional 68.0% |
| Jordanians | 97.4 /100 | #96 | Exceptional 68.0% |