Estonian vs Cherokee College, Under 1 year
COMPARE
Estonian
Cherokee
College, Under 1 year
College, Under 1 year Comparison
Estonians
Cherokee
70.6%
COLLEGE, UNDER 1 YEAR
99.9/ 100
METRIC RATING
34th/ 347
METRIC RANK
60.1%
COLLEGE, UNDER 1 YEAR
0.1/ 100
METRIC RATING
281st/ 347
METRIC RANK
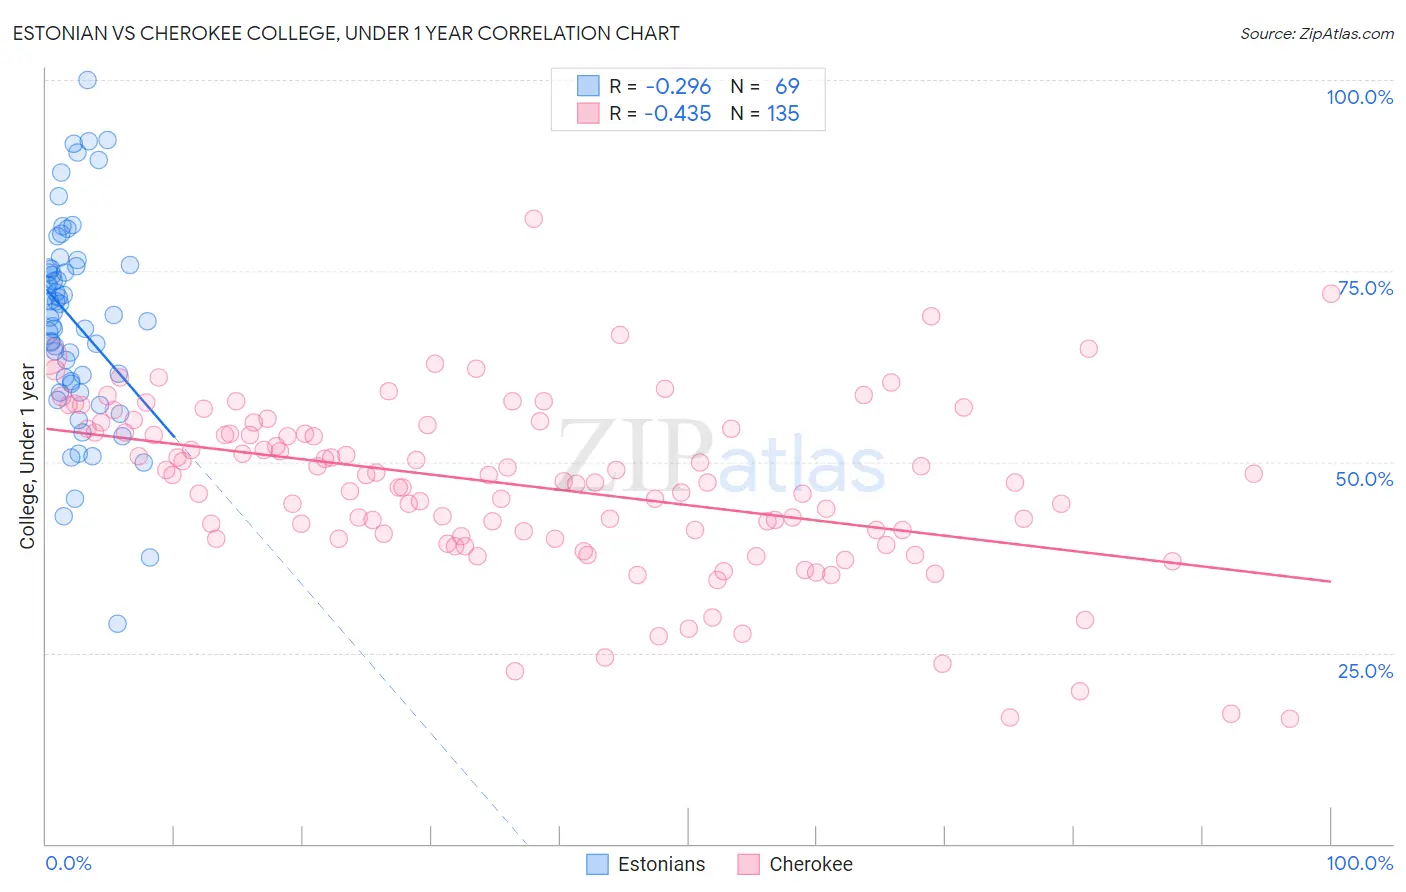
Estonian vs Cherokee College, Under 1 year Correlation Chart
The statistical analysis conducted on geographies consisting of 123,528,478 people shows a weak negative correlation between the proportion of Estonians and percentage of population with at least college, under 1 year education in the United States with a correlation coefficient (R) of -0.296 and weighted average of 70.6%. Similarly, the statistical analysis conducted on geographies consisting of 493,717,865 people shows a moderate negative correlation between the proportion of Cherokee and percentage of population with at least college, under 1 year education in the United States with a correlation coefficient (R) of -0.435 and weighted average of 60.1%, a difference of 17.4%.
College, Under 1 year Correlation Summary
| Measurement | Estonian | Cherokee |
| Minimum | 28.9% | 16.3% |
| Maximum | 100.0% | 81.8% |
| Range | 71.1% | 65.5% |
| Mean | 68.4% | 46.9% |
| Median | 69.2% | 47.4% |
| Interquartile 25% (IQ1) | 60.4% | 40.3% |
| Interquartile 75% (IQ3) | 75.5% | 54.4% |
| Interquartile Range (IQR) | 15.1% | 14.2% |
| Standard Deviation (Sample) | 13.3% | 11.2% |
| Standard Deviation (Population) | 13.2% | 11.2% |
Similar Demographics by College, Under 1 year
Demographics Similar to Estonians by College, Under 1 year
In terms of college, under 1 year, the demographic groups most similar to Estonians are Immigrants from South Africa (70.6%, a difference of 0.020%), Russian (70.5%, a difference of 0.080%), Immigrants from Sri Lanka (70.5%, a difference of 0.15%), Turkish (70.7%, a difference of 0.18%), and Immigrants from Saudi Arabia (70.4%, a difference of 0.26%).
| Demographics | Rating | Rank | College, Under 1 year |
| Immigrants | Ireland | 100.0 /100 | #27 | Exceptional 71.0% |
| Immigrants | Hong Kong | 100.0 /100 | #28 | Exceptional 71.0% |
| Immigrants | France | 100.0 /100 | #29 | Exceptional 71.0% |
| Immigrants | China | 99.9 /100 | #30 | Exceptional 70.9% |
| Indians (Asian) | 99.9 /100 | #31 | Exceptional 70.8% |
| Turks | 99.9 /100 | #32 | Exceptional 70.7% |
| Immigrants | South Africa | 99.9 /100 | #33 | Exceptional 70.6% |
| Estonians | 99.9 /100 | #34 | Exceptional 70.6% |
| Russians | 99.9 /100 | #35 | Exceptional 70.5% |
| Immigrants | Sri Lanka | 99.9 /100 | #36 | Exceptional 70.5% |
| Immigrants | Saudi Arabia | 99.9 /100 | #37 | Exceptional 70.4% |
| Australians | 99.9 /100 | #38 | Exceptional 70.4% |
| Bhutanese | 99.9 /100 | #39 | Exceptional 70.3% |
| Immigrants | Turkey | 99.9 /100 | #40 | Exceptional 70.3% |
| Immigrants | Kuwait | 99.9 /100 | #41 | Exceptional 70.3% |
Demographics Similar to Cherokee by College, Under 1 year
In terms of college, under 1 year, the demographic groups most similar to Cherokee are Belizean (60.1%, a difference of 0.040%), Crow (60.2%, a difference of 0.11%), Ute (60.2%, a difference of 0.20%), Yaqui (60.2%, a difference of 0.21%), and Bahamian (60.3%, a difference of 0.25%).
| Demographics | Rating | Rank | College, Under 1 year |
| Alaska Natives | 0.1 /100 | #274 | Tragic 60.4% |
| Immigrants | Barbados | 0.1 /100 | #275 | Tragic 60.4% |
| Arapaho | 0.1 /100 | #276 | Tragic 60.3% |
| Bahamians | 0.1 /100 | #277 | Tragic 60.3% |
| Yaqui | 0.1 /100 | #278 | Tragic 60.2% |
| Ute | 0.1 /100 | #279 | Tragic 60.2% |
| Crow | 0.1 /100 | #280 | Tragic 60.2% |
| Cherokee | 0.1 /100 | #281 | Tragic 60.1% |
| Belizeans | 0.1 /100 | #282 | Tragic 60.1% |
| Immigrants | Jamaica | 0.0 /100 | #283 | Tragic 59.7% |
| Immigrants | St. Vincent and the Grenadines | 0.0 /100 | #284 | Tragic 59.6% |
| Paiute | 0.0 /100 | #285 | Tragic 59.6% |
| British West Indians | 0.0 /100 | #286 | Tragic 59.5% |
| Sioux | 0.0 /100 | #287 | Tragic 59.4% |
| Blacks/African Americans | 0.0 /100 | #288 | Tragic 59.4% |