Asian vs Immigrants from Uganda 7th Grade
COMPARE
Asian
Immigrants from Uganda
7th Grade
7th Grade Comparison
Asians
Immigrants from Uganda
95.5%
7TH GRADE
2.6/ 100
METRIC RATING
236th/ 347
METRIC RANK
96.0%
7TH GRADE
36.0/ 100
METRIC RATING
187th/ 347
METRIC RANK
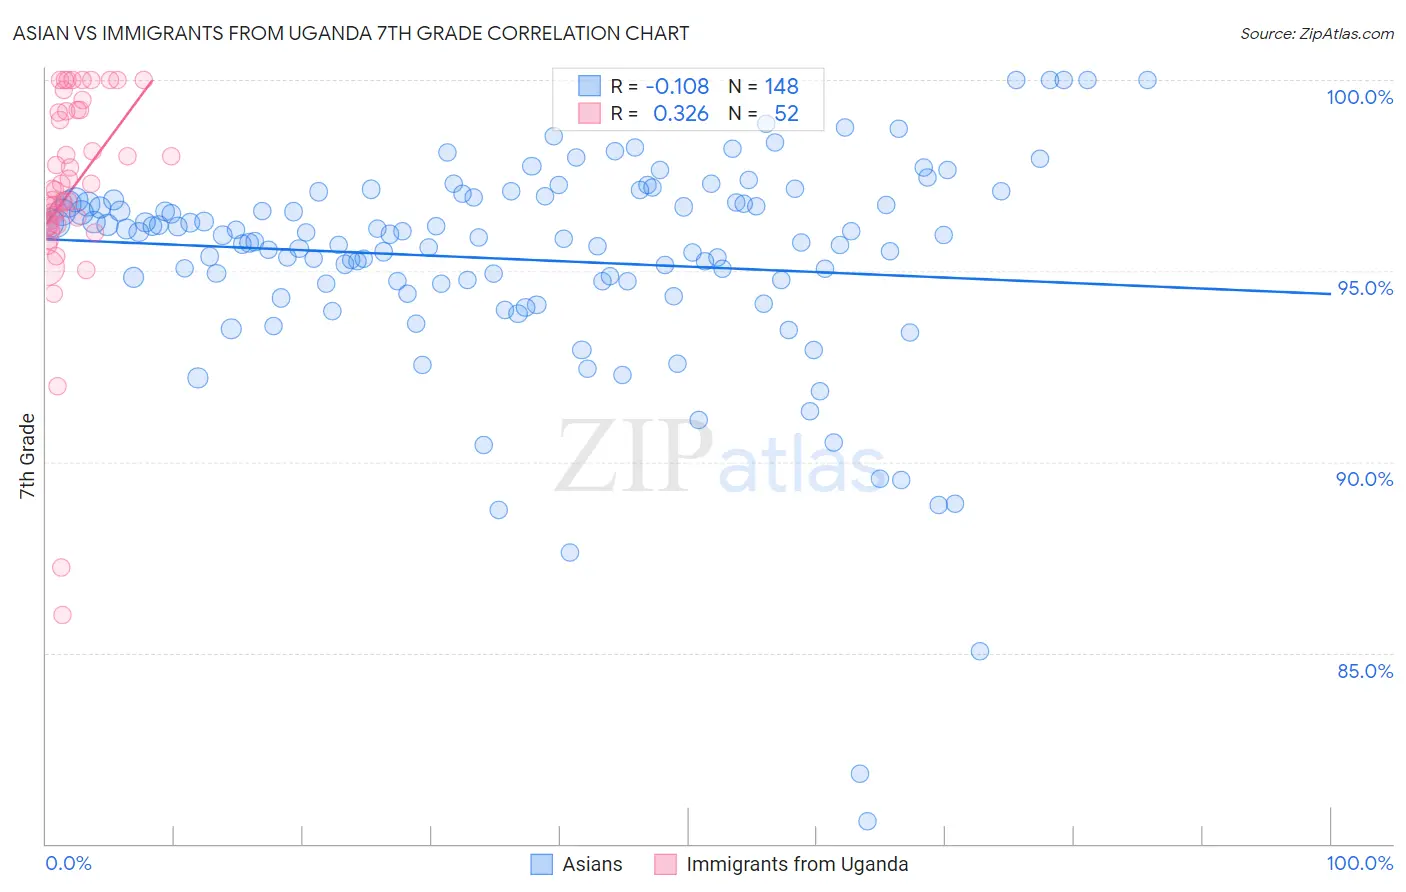
Asian vs Immigrants from Uganda 7th Grade Correlation Chart
The statistical analysis conducted on geographies consisting of 550,917,032 people shows a poor negative correlation between the proportion of Asians and percentage of population with at least 7th grade education in the United States with a correlation coefficient (R) of -0.108 and weighted average of 95.5%. Similarly, the statistical analysis conducted on geographies consisting of 125,943,496 people shows a mild positive correlation between the proportion of Immigrants from Uganda and percentage of population with at least 7th grade education in the United States with a correlation coefficient (R) of 0.326 and weighted average of 96.0%, a difference of 0.47%.
7th Grade Correlation Summary
| Measurement | Asian | Immigrants from Uganda |
| Minimum | 80.6% | 86.0% |
| Maximum | 100.0% | 100.0% |
| Range | 19.4% | 14.0% |
| Mean | 95.3% | 97.1% |
| Median | 95.9% | 97.1% |
| Interquartile 25% (IQ1) | 94.7% | 96.2% |
| Interquartile 75% (IQ3) | 96.9% | 99.2% |
| Interquartile Range (IQR) | 2.2% | 3.0% |
| Standard Deviation (Sample) | 2.9% | 2.8% |
| Standard Deviation (Population) | 2.9% | 2.7% |
Similar Demographics by 7th Grade
Demographics Similar to Asians by 7th Grade
In terms of 7th grade, the demographic groups most similar to Asians are Immigrants from Africa (95.5%, a difference of 0.010%), Immigrants from Asia (95.5%, a difference of 0.010%), Nigerian (95.5%, a difference of 0.020%), Indian (Asian) (95.5%, a difference of 0.020%), and Jamaican (95.5%, a difference of 0.030%).
| Demographics | Rating | Rank | 7th Grade |
| Immigrants | Panama | 4.9 /100 | #229 | Tragic 95.6% |
| Natives/Alaskans | 4.2 /100 | #230 | Tragic 95.6% |
| Senegalese | 4.0 /100 | #231 | Tragic 95.6% |
| Costa Ricans | 3.3 /100 | #232 | Tragic 95.5% |
| Immigrants | Indonesia | 3.3 /100 | #233 | Tragic 95.5% |
| Nigerians | 3.0 /100 | #234 | Tragic 95.5% |
| Immigrants | Africa | 2.7 /100 | #235 | Tragic 95.5% |
| Asians | 2.6 /100 | #236 | Tragic 95.5% |
| Immigrants | Asia | 2.3 /100 | #237 | Tragic 95.5% |
| Indians (Asian) | 2.3 /100 | #238 | Tragic 95.5% |
| Jamaicans | 2.2 /100 | #239 | Tragic 95.5% |
| Immigrants | Sierra Leone | 2.0 /100 | #240 | Tragic 95.5% |
| South American Indians | 2.0 /100 | #241 | Tragic 95.5% |
| Immigrants | Senegal | 1.9 /100 | #242 | Tragic 95.5% |
| U.S. Virgin Islanders | 1.6 /100 | #243 | Tragic 95.4% |
Demographics Similar to Immigrants from Uganda by 7th Grade
In terms of 7th grade, the demographic groups most similar to Immigrants from Uganda are Immigrants from Iraq (96.0%, a difference of 0.0%), Sierra Leonean (96.0%, a difference of 0.010%), Brazilian (96.0%, a difference of 0.010%), Immigrants from Egypt (95.9%, a difference of 0.010%), and Immigrants from Venezuela (95.9%, a difference of 0.010%).
| Demographics | Rating | Rank | 7th Grade |
| Immigrants | Brazil | 46.8 /100 | #180 | Average 96.0% |
| Pakistanis | 44.5 /100 | #181 | Average 96.0% |
| Iraqis | 41.2 /100 | #182 | Average 96.0% |
| Immigrants | Spain | 38.8 /100 | #183 | Fair 96.0% |
| Sierra Leoneans | 37.5 /100 | #184 | Fair 96.0% |
| Brazilians | 37.3 /100 | #185 | Fair 96.0% |
| Immigrants | Iraq | 36.1 /100 | #186 | Fair 96.0% |
| Immigrants | Uganda | 36.0 /100 | #187 | Fair 96.0% |
| Immigrants | Egypt | 34.3 /100 | #188 | Fair 95.9% |
| Immigrants | Venezuela | 33.9 /100 | #189 | Fair 95.9% |
| Immigrants | Micronesia | 32.6 /100 | #190 | Fair 95.9% |
| Liberians | 32.5 /100 | #191 | Fair 95.9% |
| Panamanians | 32.3 /100 | #192 | Fair 95.9% |
| Immigrants | Bahamas | 30.8 /100 | #193 | Fair 95.9% |
| Immigrants | Nepal | 30.0 /100 | #194 | Fair 95.9% |