Asian vs Kenyan College, Under 1 year
COMPARE
Asian
Kenyan
College, Under 1 year
College, Under 1 year Comparison
Asians
Kenyans
69.4%
COLLEGE, UNDER 1 YEAR
99.6/ 100
METRIC RATING
57th/ 347
METRIC RANK
66.5%
COLLEGE, UNDER 1 YEAR
81.7/ 100
METRIC RATING
146th/ 347
METRIC RANK
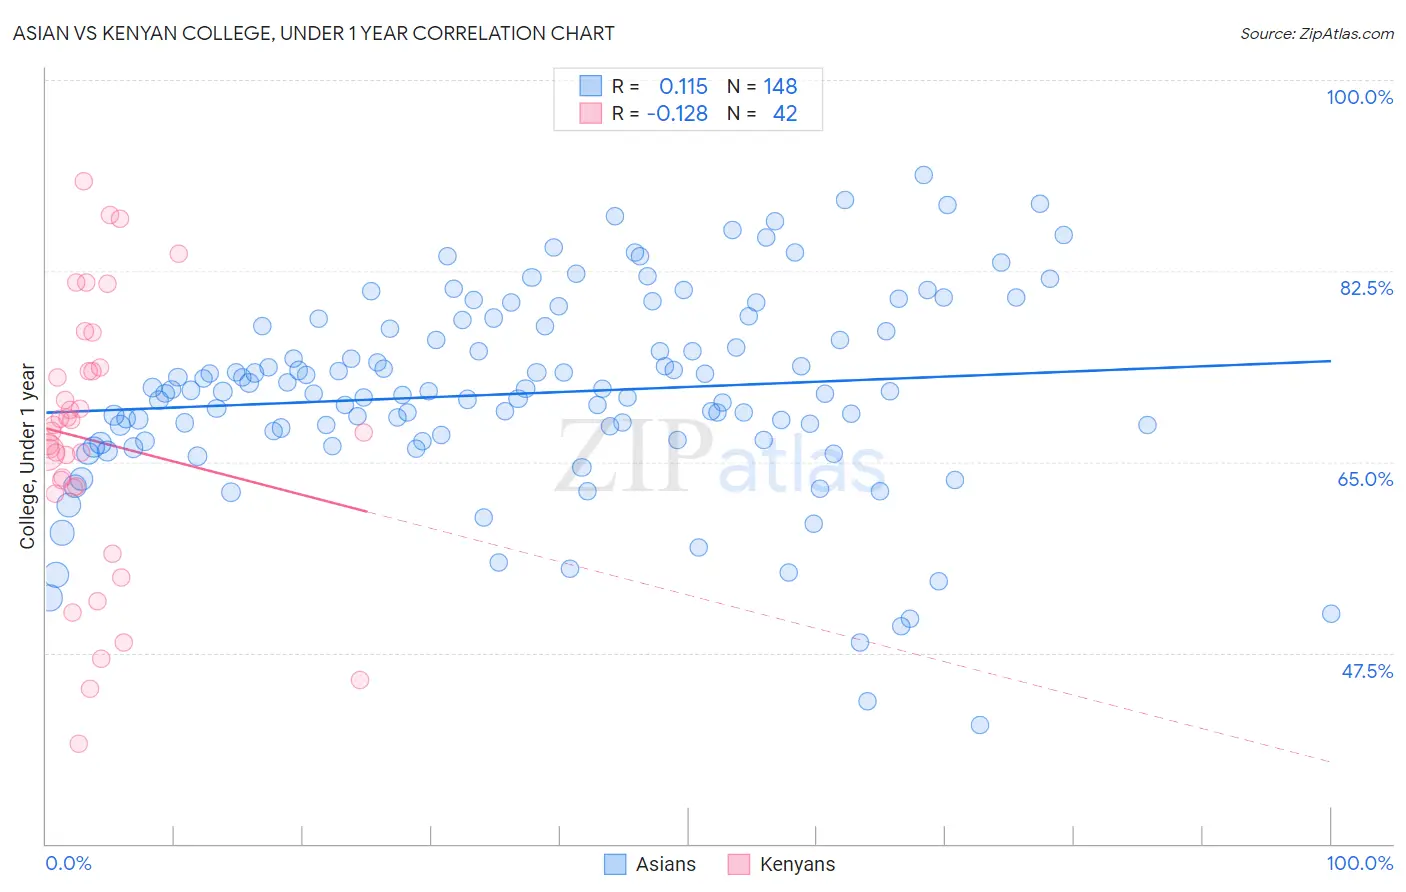
Asian vs Kenyan College, Under 1 year Correlation Chart
The statistical analysis conducted on geographies consisting of 550,912,370 people shows a poor positive correlation between the proportion of Asians and percentage of population with at least college, under 1 year education in the United States with a correlation coefficient (R) of 0.115 and weighted average of 69.4%. Similarly, the statistical analysis conducted on geographies consisting of 168,244,481 people shows a poor negative correlation between the proportion of Kenyans and percentage of population with at least college, under 1 year education in the United States with a correlation coefficient (R) of -0.128 and weighted average of 66.5%, a difference of 4.4%.
College, Under 1 year Correlation Summary
| Measurement | Asian | Kenyan |
| Minimum | 40.9% | 39.1% |
| Maximum | 91.3% | 90.7% |
| Range | 50.4% | 51.6% |
| Mean | 71.3% | 66.9% |
| Median | 71.5% | 67.8% |
| Interquartile 25% (IQ1) | 67.0% | 62.7% |
| Interquartile 75% (IQ3) | 77.3% | 73.3% |
| Interquartile Range (IQR) | 10.3% | 10.6% |
| Standard Deviation (Sample) | 9.2% | 12.2% |
| Standard Deviation (Population) | 9.1% | 12.0% |
Similar Demographics by College, Under 1 year
Demographics Similar to Asians by College, Under 1 year
In terms of college, under 1 year, the demographic groups most similar to Asians are Immigrants from Scotland (69.4%, a difference of 0.020%), Immigrants from Malaysia (69.3%, a difference of 0.10%), Maltese (69.5%, a difference of 0.14%), Immigrants from Serbia (69.3%, a difference of 0.23%), and Immigrants from Czechoslovakia (69.6%, a difference of 0.25%).
| Demographics | Rating | Rank | College, Under 1 year |
| Zimbabweans | 99.8 /100 | #50 | Exceptional 69.9% |
| Mongolians | 99.8 /100 | #51 | Exceptional 69.9% |
| Immigrants | Russia | 99.8 /100 | #52 | Exceptional 69.9% |
| South Africans | 99.7 /100 | #53 | Exceptional 69.7% |
| Immigrants | Czechoslovakia | 99.7 /100 | #54 | Exceptional 69.6% |
| Maltese | 99.7 /100 | #55 | Exceptional 69.5% |
| Immigrants | Scotland | 99.6 /100 | #56 | Exceptional 69.4% |
| Asians | 99.6 /100 | #57 | Exceptional 69.4% |
| Immigrants | Malaysia | 99.6 /100 | #58 | Exceptional 69.3% |
| Immigrants | Serbia | 99.5 /100 | #59 | Exceptional 69.3% |
| Immigrants | Asia | 99.5 /100 | #60 | Exceptional 69.2% |
| Immigrants | Kazakhstan | 99.5 /100 | #61 | Exceptional 69.2% |
| Immigrants | Belarus | 99.5 /100 | #62 | Exceptional 69.2% |
| Immigrants | Canada | 99.4 /100 | #63 | Exceptional 69.1% |
| Northern Europeans | 99.4 /100 | #64 | Exceptional 69.0% |
Demographics Similar to Kenyans by College, Under 1 year
In terms of college, under 1 year, the demographic groups most similar to Kenyans are Immigrants from Kenya (66.5%, a difference of 0.0%), Immigrants from Morocco (66.5%, a difference of 0.0%), Immigrants from Germany (66.5%, a difference of 0.020%), Immigrants from Uganda (66.5%, a difference of 0.080%), and English (66.6%, a difference of 0.090%).
| Demographics | Rating | Rank | College, Under 1 year |
| Venezuelans | 85.9 /100 | #139 | Excellent 66.7% |
| Slavs | 85.9 /100 | #140 | Excellent 66.7% |
| Immigrants | Afghanistan | 85.1 /100 | #141 | Excellent 66.7% |
| English | 82.9 /100 | #142 | Excellent 66.6% |
| Immigrants | Uganda | 82.8 /100 | #143 | Excellent 66.5% |
| Immigrants | Germany | 82.0 /100 | #144 | Excellent 66.5% |
| Immigrants | Kenya | 81.8 /100 | #145 | Excellent 66.5% |
| Kenyans | 81.7 /100 | #146 | Excellent 66.5% |
| Immigrants | Morocco | 81.7 /100 | #147 | Excellent 66.5% |
| Taiwanese | 78.6 /100 | #148 | Good 66.4% |
| Immigrants | Venezuela | 77.9 /100 | #149 | Good 66.3% |
| Immigrants | Iraq | 77.1 /100 | #150 | Good 66.3% |
| Immigrants | Sudan | 76.0 /100 | #151 | Good 66.2% |
| Sudanese | 74.1 /100 | #152 | Good 66.2% |
| Belgians | 73.7 /100 | #153 | Good 66.2% |