Asian vs Immigrants from Albania Doctorate Degree
COMPARE
Asian
Immigrants from Albania
Doctorate Degree
Doctorate Degree Comparison
Asians
Immigrants from Albania
2.4%
DOCTORATE DEGREE
100.0/ 100
METRIC RATING
48th/ 347
METRIC RANK
1.9%
DOCTORATE DEGREE
72.8/ 100
METRIC RATING
154th/ 347
METRIC RANK
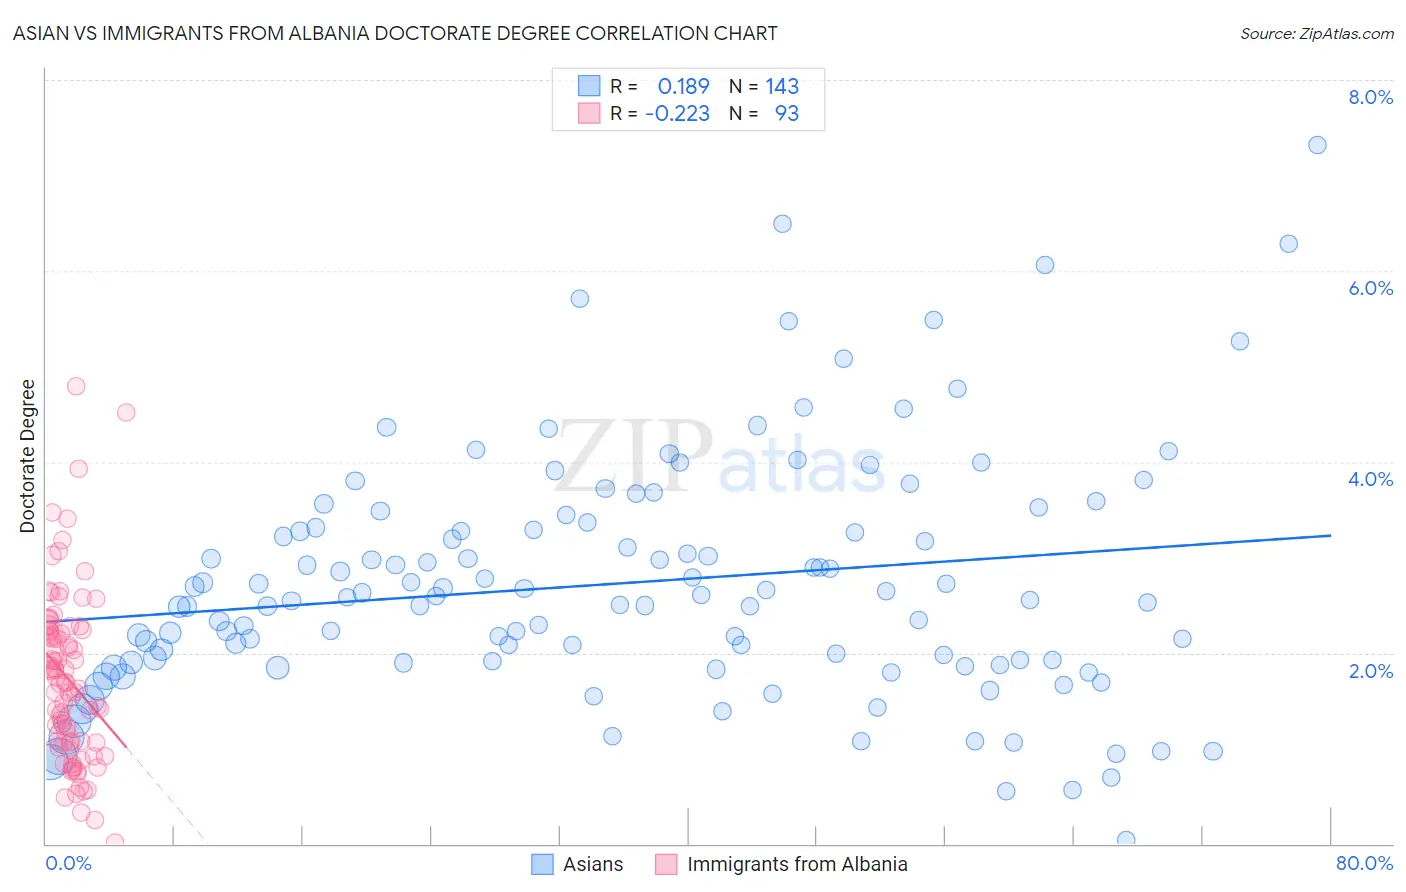
Asian vs Immigrants from Albania Doctorate Degree Correlation Chart
The statistical analysis conducted on geographies consisting of 534,469,334 people shows a poor positive correlation between the proportion of Asians and percentage of population with at least doctorate degree education in the United States with a correlation coefficient (R) of 0.189 and weighted average of 2.4%. Similarly, the statistical analysis conducted on geographies consisting of 119,213,784 people shows a weak negative correlation between the proportion of Immigrants from Albania and percentage of population with at least doctorate degree education in the United States with a correlation coefficient (R) of -0.223 and weighted average of 1.9%, a difference of 27.5%.
Doctorate Degree Correlation Summary
| Measurement | Asian | Immigrants from Albania |
| Minimum | 0.043% | 0.013% |
| Maximum | 7.3% | 4.8% |
| Range | 7.3% | 4.8% |
| Mean | 2.7% | 1.7% |
| Median | 2.6% | 1.7% |
| Interquartile 25% (IQ1) | 1.9% | 1.1% |
| Interquartile 75% (IQ3) | 3.3% | 2.2% |
| Interquartile Range (IQR) | 1.4% | 1.2% |
| Standard Deviation (Sample) | 1.3% | 0.90% |
| Standard Deviation (Population) | 1.3% | 0.89% |
Similar Demographics by Doctorate Degree
Demographics Similar to Asians by Doctorate Degree
In terms of doctorate degree, the demographic groups most similar to Asians are Immigrants from Asia (2.4%, a difference of 0.13%), Immigrants from Western Europe (2.4%, a difference of 0.21%), Immigrants from Austria (2.4%, a difference of 0.44%), Immigrants from South Africa (2.4%, a difference of 0.57%), and Immigrants from Norway (2.4%, a difference of 1.3%).
| Demographics | Rating | Rank | Doctorate Degree |
| Immigrants | Russia | 100.0 /100 | #41 | Exceptional 2.5% |
| New Zealanders | 100.0 /100 | #42 | Exceptional 2.5% |
| Soviet Union | 100.0 /100 | #43 | Exceptional 2.5% |
| Immigrants | Netherlands | 100.0 /100 | #44 | Exceptional 2.5% |
| Immigrants | South Africa | 100.0 /100 | #45 | Exceptional 2.4% |
| Immigrants | Austria | 100.0 /100 | #46 | Exceptional 2.4% |
| Immigrants | Western Europe | 100.0 /100 | #47 | Exceptional 2.4% |
| Asians | 100.0 /100 | #48 | Exceptional 2.4% |
| Immigrants | Asia | 100.0 /100 | #49 | Exceptional 2.4% |
| Immigrants | Norway | 100.0 /100 | #50 | Exceptional 2.4% |
| Australians | 100.0 /100 | #51 | Exceptional 2.4% |
| Bulgarians | 100.0 /100 | #52 | Exceptional 2.4% |
| Immigrants | Latvia | 100.0 /100 | #53 | Exceptional 2.4% |
| Immigrants | Indonesia | 100.0 /100 | #54 | Exceptional 2.4% |
| Bolivians | 100.0 /100 | #55 | Exceptional 2.4% |
Demographics Similar to Immigrants from Albania by Doctorate Degree
In terms of doctorate degree, the demographic groups most similar to Immigrants from Albania are Polish (1.9%, a difference of 0.020%), Slavic (1.9%, a difference of 0.080%), Danish (1.9%, a difference of 0.16%), Hungarian (1.9%, a difference of 0.19%), and Immigrants from Oceania (1.9%, a difference of 0.22%).
| Demographics | Rating | Rank | Doctorate Degree |
| Immigrants | Senegal | 82.5 /100 | #147 | Excellent 1.9% |
| Luxembourgers | 81.1 /100 | #148 | Excellent 1.9% |
| Basques | 76.9 /100 | #149 | Good 1.9% |
| English | 75.9 /100 | #150 | Good 1.9% |
| Albanians | 74.8 /100 | #151 | Good 1.9% |
| Immigrants | Kenya | 74.3 /100 | #152 | Good 1.9% |
| Immigrants | Oceania | 74.0 /100 | #153 | Good 1.9% |
| Immigrants | Albania | 72.8 /100 | #154 | Good 1.9% |
| Poles | 72.7 /100 | #155 | Good 1.9% |
| Slavs | 72.4 /100 | #156 | Good 1.9% |
| Danes | 71.9 /100 | #157 | Good 1.9% |
| Hungarians | 71.7 /100 | #158 | Good 1.9% |
| Slovenes | 70.2 /100 | #159 | Good 1.9% |
| Welsh | 69.7 /100 | #160 | Good 1.9% |
| Immigrants | Middle Africa | 68.8 /100 | #161 | Good 1.9% |