Armenian vs Navajo 9th Grade
COMPARE
Armenian
Navajo
9th Grade
9th Grade Comparison
Armenians
Navajo
93.9%
9TH GRADE
0.3/ 100
METRIC RATING
267th/ 347
METRIC RANK
93.9%
9TH GRADE
0.3/ 100
METRIC RATING
266th/ 347
METRIC RANK
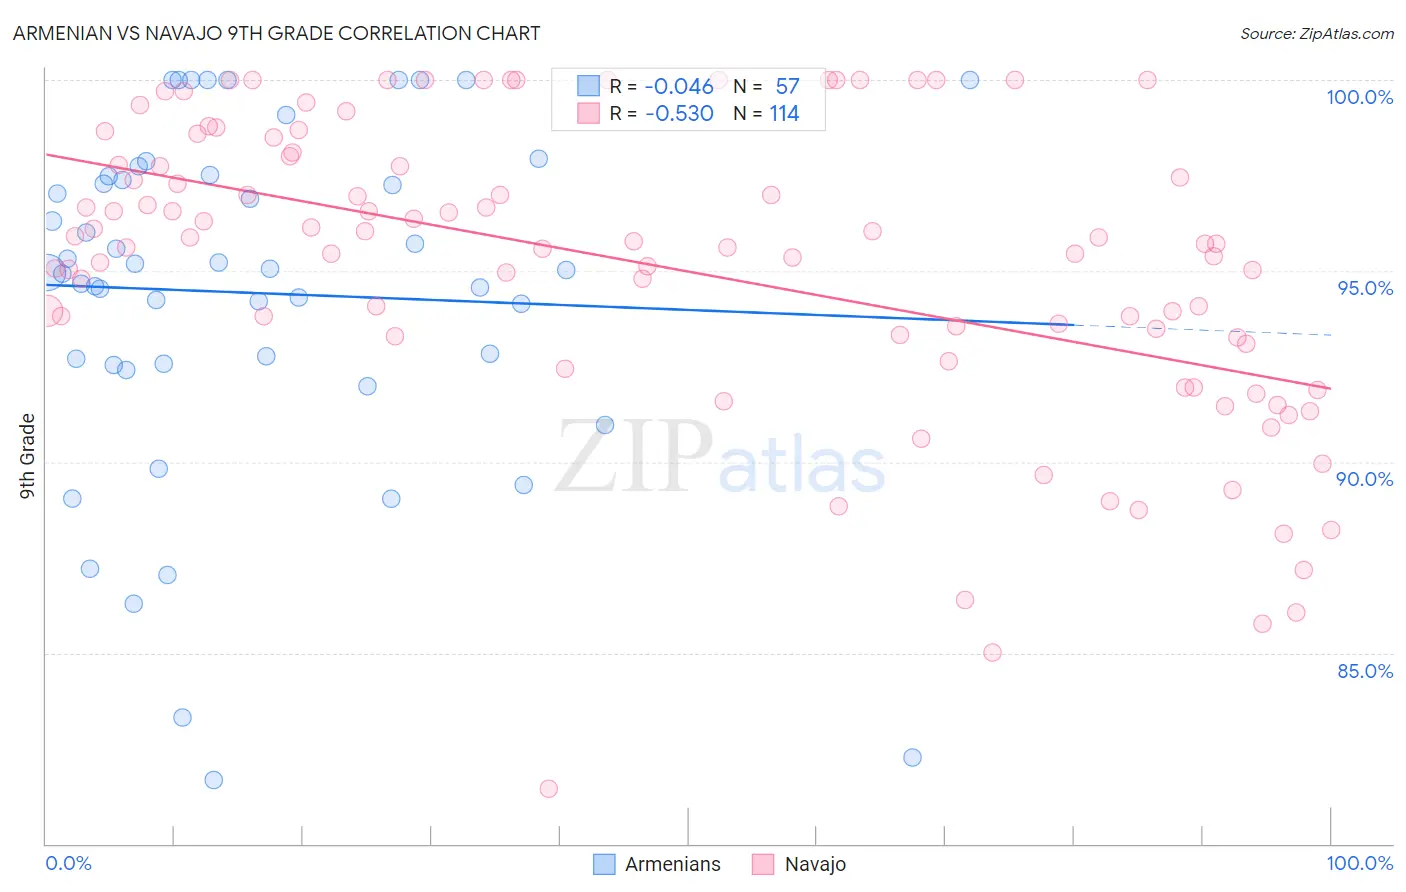
Armenian vs Navajo 9th Grade Correlation Chart
The statistical analysis conducted on geographies consisting of 310,954,801 people shows no correlation between the proportion of Armenians and percentage of population with at least 9th grade education in the United States with a correlation coefficient (R) of -0.046 and weighted average of 93.9%. Similarly, the statistical analysis conducted on geographies consisting of 224,872,587 people shows a substantial negative correlation between the proportion of Navajo and percentage of population with at least 9th grade education in the United States with a correlation coefficient (R) of -0.530 and weighted average of 93.9%, a difference of 0.020%.
9th Grade Correlation Summary
| Measurement | Armenian | Navajo |
| Minimum | 81.7% | 81.4% |
| Maximum | 100.0% | 100.0% |
| Range | 18.3% | 18.6% |
| Mean | 94.4% | 95.1% |
| Median | 95.0% | 95.7% |
| Interquartile 25% (IQ1) | 92.6% | 93.2% |
| Interquartile 75% (IQ3) | 97.5% | 98.0% |
| Interquartile Range (IQR) | 4.9% | 4.8% |
| Standard Deviation (Sample) | 4.5% | 3.9% |
| Standard Deviation (Population) | 4.5% | 3.9% |
Demographics Similar to Armenians and Navajo by 9th Grade
In terms of 9th grade, the demographic groups most similar to Armenians are Immigrants from Bolivia (93.9%, a difference of 0.020%), Immigrants from Uzbekistan (93.9%, a difference of 0.030%), Immigrants from Congo (93.9%, a difference of 0.030%), Native/Alaskan (93.9%, a difference of 0.030%), and Immigrants from Jamaica (93.9%, a difference of 0.040%). Similarly, the demographic groups most similar to Navajo are Immigrants from Congo (93.9%, a difference of 0.010%), Native/Alaskan (93.9%, a difference of 0.010%), Immigrants from Jamaica (93.9%, a difference of 0.020%), Immigrants from Uzbekistan (93.9%, a difference of 0.020%), and Immigrants from Bolivia (93.9%, a difference of 0.030%).
| Demographics | Rating | Rank | 9th Grade |
| Immigrants | Afghanistan | 0.5 /100 | #256 | Tragic 94.0% |
| Immigrants | Costa Rica | 0.5 /100 | #257 | Tragic 94.0% |
| Immigrants | Thailand | 0.5 /100 | #258 | Tragic 93.9% |
| Ghanaians | 0.5 /100 | #259 | Tragic 93.9% |
| Pima | 0.4 /100 | #260 | Tragic 93.9% |
| South Americans | 0.4 /100 | #261 | Tragic 93.9% |
| Immigrants | Jamaica | 0.4 /100 | #262 | Tragic 93.9% |
| Immigrants | Uzbekistan | 0.4 /100 | #263 | Tragic 93.9% |
| Immigrants | Congo | 0.4 /100 | #264 | Tragic 93.9% |
| Natives/Alaskans | 0.4 /100 | #265 | Tragic 93.9% |
| Navajo | 0.3 /100 | #266 | Tragic 93.9% |
| Armenians | 0.3 /100 | #267 | Tragic 93.9% |
| Immigrants | Bolivia | 0.3 /100 | #268 | Tragic 93.9% |
| Immigrants | Uruguay | 0.2 /100 | #269 | Tragic 93.8% |
| Yuman | 0.2 /100 | #270 | Tragic 93.8% |
| Immigrants | Ghana | 0.2 /100 | #271 | Tragic 93.8% |
| Immigrants | Western Africa | 0.2 /100 | #272 | Tragic 93.8% |
| Immigrants | South America | 0.2 /100 | #273 | Tragic 93.8% |
| Peruvians | 0.2 /100 | #274 | Tragic 93.8% |
| Immigrants | Colombia | 0.2 /100 | #275 | Tragic 93.8% |
| West Indians | 0.2 /100 | #276 | Tragic 93.7% |