Armenian vs Crow Master's Degree
COMPARE
Armenian
Crow
Master's Degree
Master's Degree Comparison
Armenians
Crow
16.8%
MASTER'S DEGREE
98.0/ 100
METRIC RATING
107th/ 347
METRIC RANK
10.6%
MASTER'S DEGREE
0.0/ 100
METRIC RATING
323rd/ 347
METRIC RANK
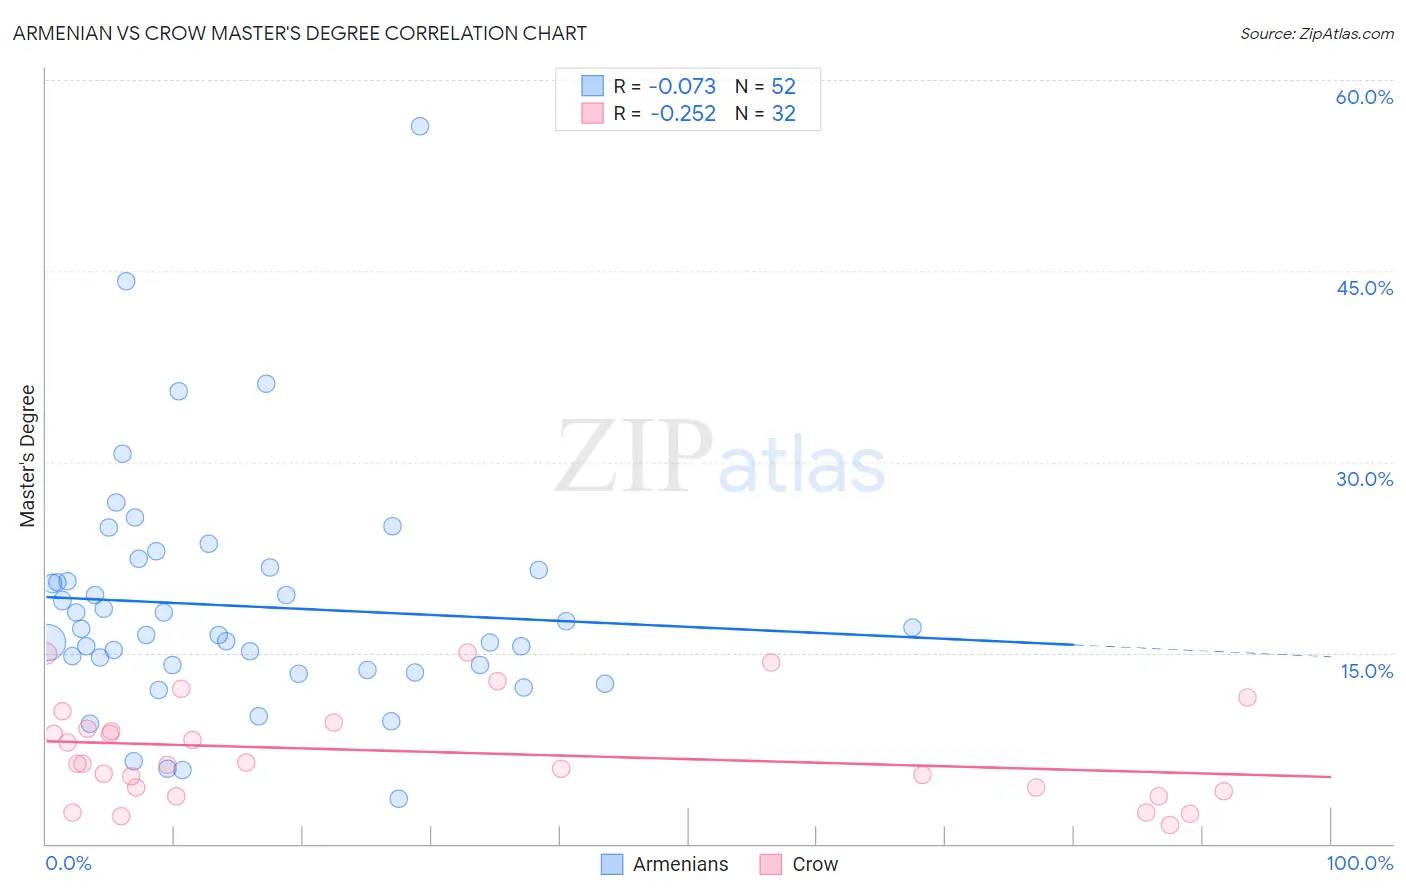
Armenian vs Crow Master's Degree Correlation Chart
The statistical analysis conducted on geographies consisting of 310,885,780 people shows a slight negative correlation between the proportion of Armenians and percentage of population with at least master's degree education in the United States with a correlation coefficient (R) of -0.073 and weighted average of 16.8%. Similarly, the statistical analysis conducted on geographies consisting of 59,200,277 people shows a weak negative correlation between the proportion of Crow and percentage of population with at least master's degree education in the United States with a correlation coefficient (R) of -0.252 and weighted average of 10.6%, a difference of 57.9%.
Master's Degree Correlation Summary
| Measurement | Armenian | Crow |
| Minimum | 3.6% | 1.4% |
| Maximum | 56.3% | 15.0% |
| Range | 52.8% | 13.6% |
| Mean | 18.7% | 7.2% |
| Median | 16.7% | 6.2% |
| Interquartile 25% (IQ1) | 13.8% | 4.3% |
| Interquartile 75% (IQ3) | 21.6% | 9.3% |
| Interquartile Range (IQR) | 7.7% | 5.0% |
| Standard Deviation (Sample) | 9.3% | 3.9% |
| Standard Deviation (Population) | 9.2% | 3.8% |
Similar Demographics by Master's Degree
Demographics Similar to Armenians by Master's Degree
In terms of master's degree, the demographic groups most similar to Armenians are Sierra Leonean (16.8%, a difference of 0.030%), Moroccan (16.8%, a difference of 0.050%), Immigrants from Chile (16.8%, a difference of 0.080%), Immigrants from Albania (16.8%, a difference of 0.090%), and Austrian (16.7%, a difference of 0.35%).
| Demographics | Rating | Rank | Master's Degree |
| Albanians | 98.7 /100 | #100 | Exceptional 17.0% |
| Immigrants | Nepal | 98.6 /100 | #101 | Exceptional 17.0% |
| Chileans | 98.6 /100 | #102 | Exceptional 16.9% |
| Alsatians | 98.4 /100 | #103 | Exceptional 16.9% |
| Ukrainians | 98.3 /100 | #104 | Exceptional 16.9% |
| Syrians | 98.3 /100 | #105 | Exceptional 16.8% |
| Immigrants | Albania | 98.1 /100 | #106 | Exceptional 16.8% |
| Armenians | 98.0 /100 | #107 | Exceptional 16.8% |
| Sierra Leoneans | 98.0 /100 | #108 | Exceptional 16.8% |
| Moroccans | 98.0 /100 | #109 | Exceptional 16.8% |
| Immigrants | Chile | 98.0 /100 | #110 | Exceptional 16.8% |
| Austrians | 97.8 /100 | #111 | Exceptional 16.7% |
| Macedonians | 97.7 /100 | #112 | Exceptional 16.7% |
| Arabs | 97.7 /100 | #113 | Exceptional 16.7% |
| Northern Europeans | 97.6 /100 | #114 | Exceptional 16.7% |
Demographics Similar to Crow by Master's Degree
In terms of master's degree, the demographic groups most similar to Crow are Dutch West Indian (10.6%, a difference of 0.040%), Sioux (10.7%, a difference of 0.39%), Pennsylvania German (10.7%, a difference of 1.0%), Inupiat (10.5%, a difference of 1.1%), and Creek (10.5%, a difference of 1.1%).
| Demographics | Rating | Rank | Master's Degree |
| Hispanics or Latinos | 0.0 /100 | #316 | Tragic 10.9% |
| Hopi | 0.0 /100 | #317 | Tragic 10.9% |
| Immigrants | Cuba | 0.0 /100 | #318 | Tragic 10.9% |
| Kiowa | 0.0 /100 | #319 | Tragic 10.8% |
| Immigrants | Micronesia | 0.0 /100 | #320 | Tragic 10.8% |
| Pennsylvania Germans | 0.0 /100 | #321 | Tragic 10.7% |
| Sioux | 0.0 /100 | #322 | Tragic 10.7% |
| Crow | 0.0 /100 | #323 | Tragic 10.6% |
| Dutch West Indians | 0.0 /100 | #324 | Tragic 10.6% |
| Inupiat | 0.0 /100 | #325 | Tragic 10.5% |
| Creek | 0.0 /100 | #326 | Tragic 10.5% |
| Paiute | 0.0 /100 | #327 | Tragic 10.5% |
| Bangladeshis | 0.0 /100 | #328 | Tragic 10.5% |
| Nepalese | 0.0 /100 | #329 | Tragic 10.5% |
| Fijians | 0.0 /100 | #330 | Tragic 10.3% |