Argentinean vs West Indian Unemployment Among Ages 25 to 29 years
COMPARE
Argentinean
West Indian
Unemployment Among Ages 25 to 29 years
Unemployment Among Ages 25 to 29 years Comparison
Argentineans
West Indians
6.7%
UNEMPLOYMENT AMONG AGES 25 TO 29 YEARS
32.1/ 100
METRIC RATING
189th/ 347
METRIC RANK
7.9%
UNEMPLOYMENT AMONG AGES 25 TO 29 YEARS
0.0/ 100
METRIC RATING
301st/ 347
METRIC RANK
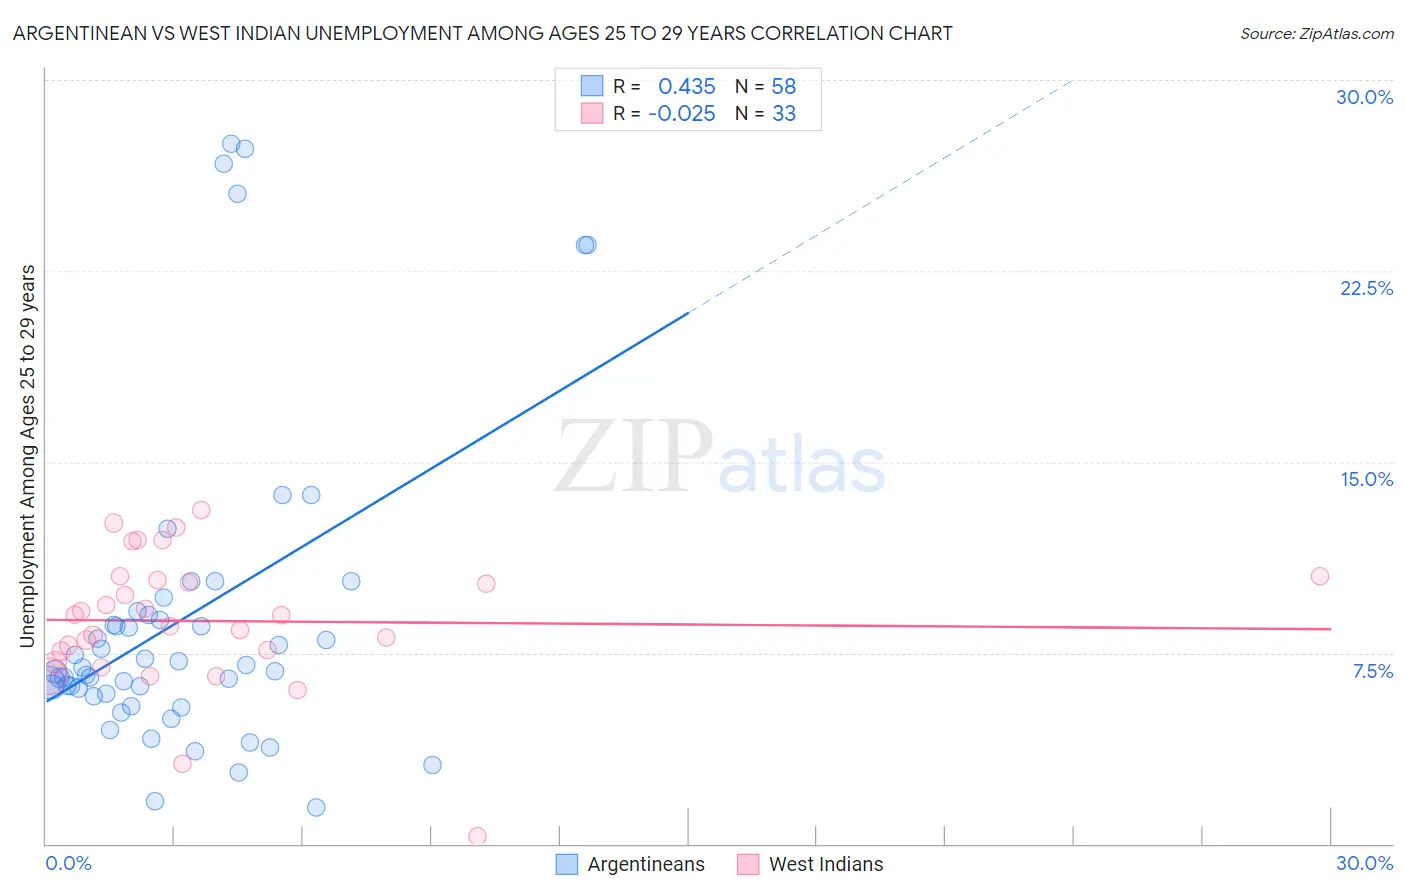
Argentinean vs West Indian Unemployment Among Ages 25 to 29 years Correlation Chart
The statistical analysis conducted on geographies consisting of 287,291,410 people shows a moderate positive correlation between the proportion of Argentineans and unemployment rate among population between the ages 25 and 29 in the United States with a correlation coefficient (R) of 0.435 and weighted average of 6.7%. Similarly, the statistical analysis conducted on geographies consisting of 247,262,358 people shows no correlation between the proportion of West Indians and unemployment rate among population between the ages 25 and 29 in the United States with a correlation coefficient (R) of -0.025 and weighted average of 7.9%, a difference of 17.5%.
Unemployment Among Ages 25 to 29 years Correlation Summary
| Measurement | Argentinean | West Indian |
| Minimum | 1.4% | 0.30% |
| Maximum | 27.5% | 13.1% |
| Range | 26.1% | 12.8% |
| Mean | 8.9% | 8.7% |
| Median | 6.9% | 9.0% |
| Interquartile 25% (IQ1) | 5.9% | 7.3% |
| Interquartile 75% (IQ3) | 9.0% | 10.4% |
| Interquartile Range (IQR) | 3.1% | 3.1% |
| Standard Deviation (Sample) | 6.3% | 2.7% |
| Standard Deviation (Population) | 6.2% | 2.6% |
Similar Demographics by Unemployment Among Ages 25 to 29 years
Demographics Similar to Argentineans by Unemployment Among Ages 25 to 29 years
In terms of unemployment among ages 25 to 29 years, the demographic groups most similar to Argentineans are Irish (6.7%, a difference of 0.050%), Immigrants from South America (6.7%, a difference of 0.060%), Immigrants from Iran (6.7%, a difference of 0.16%), Korean (6.7%, a difference of 0.20%), and Moroccan (6.7%, a difference of 0.25%).
| Demographics | Rating | Rank | Unemployment Among Ages 25 to 29 years |
| Czechoslovakians | 40.7 /100 | #182 | Average 6.7% |
| Immigrants | Scotland | 39.6 /100 | #183 | Fair 6.7% |
| Immigrants | Costa Rica | 38.3 /100 | #184 | Fair 6.7% |
| Moroccans | 35.9 /100 | #185 | Fair 6.7% |
| Immigrants | Iran | 34.4 /100 | #186 | Fair 6.7% |
| Immigrants | South America | 33.0 /100 | #187 | Fair 6.7% |
| Irish | 32.8 /100 | #188 | Fair 6.7% |
| Argentineans | 32.1 /100 | #189 | Fair 6.7% |
| Koreans | 29.3 /100 | #190 | Fair 6.7% |
| Chickasaw | 28.7 /100 | #191 | Fair 6.7% |
| Immigrants | Ukraine | 28.6 /100 | #192 | Fair 6.7% |
| Alsatians | 28.1 /100 | #193 | Fair 6.7% |
| Immigrants | Greece | 28.0 /100 | #194 | Fair 6.7% |
| Immigrants | Western Asia | 27.3 /100 | #195 | Fair 6.7% |
| Hungarians | 26.8 /100 | #196 | Fair 6.8% |
Demographics Similar to West Indians by Unemployment Among Ages 25 to 29 years
In terms of unemployment among ages 25 to 29 years, the demographic groups most similar to West Indians are Central American Indian (7.9%, a difference of 0.030%), Barbadian (7.9%, a difference of 0.050%), Jamaican (7.9%, a difference of 0.16%), Immigrants from Trinidad and Tobago (7.9%, a difference of 0.22%), and Blackfeet (7.9%, a difference of 0.48%).
| Demographics | Rating | Rank | Unemployment Among Ages 25 to 29 years |
| Trinidadians and Tobagonians | 0.0 /100 | #294 | Tragic 7.8% |
| Comanche | 0.0 /100 | #295 | Tragic 7.8% |
| Immigrants | West Indies | 0.0 /100 | #296 | Tragic 7.8% |
| Blackfeet | 0.0 /100 | #297 | Tragic 7.9% |
| Immigrants | Trinidad and Tobago | 0.0 /100 | #298 | Tragic 7.9% |
| Barbadians | 0.0 /100 | #299 | Tragic 7.9% |
| Central American Indians | 0.0 /100 | #300 | Tragic 7.9% |
| West Indians | 0.0 /100 | #301 | Tragic 7.9% |
| Jamaicans | 0.0 /100 | #302 | Tragic 7.9% |
| Immigrants | Yemen | 0.0 /100 | #303 | Tragic 8.0% |
| Cajuns | 0.0 /100 | #304 | Tragic 8.0% |
| Tsimshian | 0.0 /100 | #305 | Tragic 8.0% |
| Haitians | 0.0 /100 | #306 | Tragic 8.0% |
| Immigrants | Barbados | 0.0 /100 | #307 | Tragic 8.0% |
| Immigrants | Jamaica | 0.0 /100 | #308 | Tragic 8.1% |