Argentinean vs Immigrants from France Associate's Degree
COMPARE
Argentinean
Immigrants from France
Associate's Degree
Associate's Degree Comparison
Argentineans
Immigrants from France
51.2%
ASSOCIATE'S DEGREE
99.6/ 100
METRIC RATING
67th/ 347
METRIC RANK
53.9%
ASSOCIATE'S DEGREE
100.0/ 100
METRIC RATING
29th/ 347
METRIC RANK
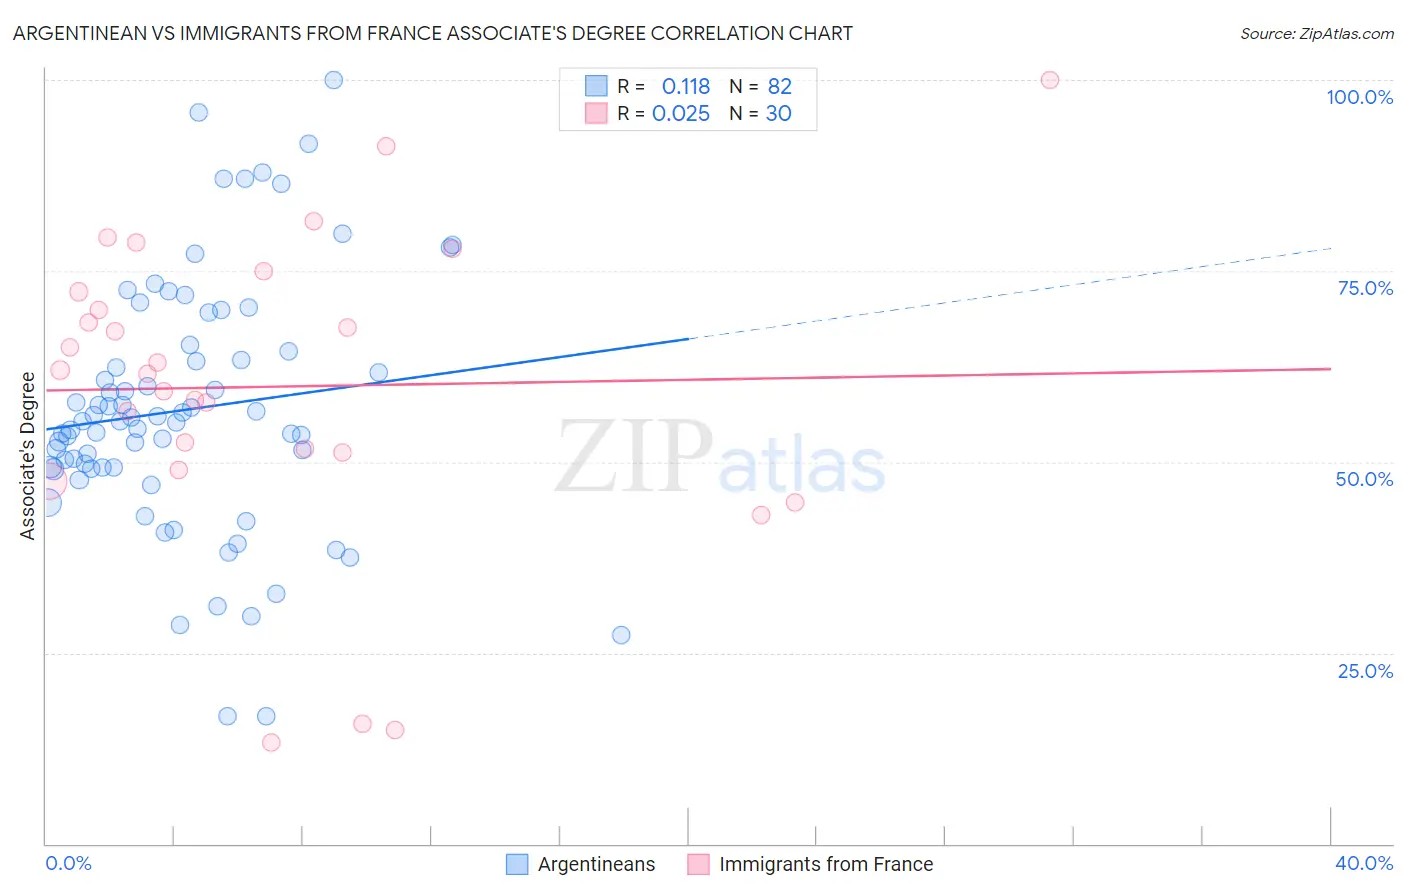
Argentinean vs Immigrants from France Associate's Degree Correlation Chart
The statistical analysis conducted on geographies consisting of 297,131,671 people shows a poor positive correlation between the proportion of Argentineans and percentage of population with at least associate's degree education in the United States with a correlation coefficient (R) of 0.118 and weighted average of 51.2%. Similarly, the statistical analysis conducted on geographies consisting of 287,913,763 people shows no correlation between the proportion of Immigrants from France and percentage of population with at least associate's degree education in the United States with a correlation coefficient (R) of 0.025 and weighted average of 53.9%, a difference of 5.1%.
Associate's Degree Correlation Summary
| Measurement | Argentinean | Immigrants from France |
| Minimum | 16.7% | 13.2% |
| Maximum | 100.0% | 100.0% |
| Range | 83.3% | 86.8% |
| Mean | 56.8% | 59.9% |
| Median | 55.3% | 61.7% |
| Interquartile 25% (IQ1) | 49.2% | 51.3% |
| Interquartile 75% (IQ3) | 64.5% | 72.3% |
| Interquartile Range (IQR) | 15.4% | 21.0% |
| Standard Deviation (Sample) | 16.6% | 20.3% |
| Standard Deviation (Population) | 16.5% | 20.0% |
Similar Demographics by Associate's Degree
Demographics Similar to Argentineans by Associate's Degree
In terms of associate's degree, the demographic groups most similar to Argentineans are Immigrants from Europe (51.3%, a difference of 0.13%), Zimbabwean (51.3%, a difference of 0.18%), Immigrants from Netherlands (51.4%, a difference of 0.22%), South African (51.4%, a difference of 0.29%), and Bhutanese (51.4%, a difference of 0.34%).
| Demographics | Rating | Rank | Associate's Degree |
| Immigrants | Bolivia | 99.7 /100 | #60 | Exceptional 51.5% |
| Immigrants | Kazakhstan | 99.7 /100 | #61 | Exceptional 51.4% |
| Bhutanese | 99.7 /100 | #62 | Exceptional 51.4% |
| South Africans | 99.7 /100 | #63 | Exceptional 51.4% |
| Immigrants | Netherlands | 99.7 /100 | #64 | Exceptional 51.4% |
| Zimbabweans | 99.7 /100 | #65 | Exceptional 51.3% |
| Immigrants | Europe | 99.7 /100 | #66 | Exceptional 51.3% |
| Argentineans | 99.6 /100 | #67 | Exceptional 51.2% |
| Immigrants | Indonesia | 99.5 /100 | #68 | Exceptional 51.0% |
| Egyptians | 99.5 /100 | #69 | Exceptional 50.9% |
| Immigrants | Argentina | 99.5 /100 | #70 | Exceptional 50.9% |
| Immigrants | Romania | 99.5 /100 | #71 | Exceptional 50.9% |
| Immigrants | Pakistan | 99.5 /100 | #72 | Exceptional 50.9% |
| Carpatho Rusyns | 99.3 /100 | #73 | Exceptional 50.6% |
| Lithuanians | 99.3 /100 | #74 | Exceptional 50.6% |
Demographics Similar to Immigrants from France by Associate's Degree
In terms of associate's degree, the demographic groups most similar to Immigrants from France are Turkish (53.9%, a difference of 0.010%), Latvian (53.9%, a difference of 0.090%), Immigrants from Sri Lanka (53.7%, a difference of 0.42%), Immigrants from Northern Europe (53.5%, a difference of 0.78%), and Immigrants from Turkey (53.4%, a difference of 0.81%).
| Demographics | Rating | Rank | Associate's Degree |
| Immigrants | Japan | 100.0 /100 | #22 | Exceptional 54.6% |
| Burmese | 100.0 /100 | #23 | Exceptional 54.6% |
| Immigrants | Korea | 100.0 /100 | #24 | Exceptional 54.5% |
| Immigrants | Switzerland | 100.0 /100 | #25 | Exceptional 54.5% |
| Immigrants | Belgium | 100.0 /100 | #26 | Exceptional 54.5% |
| Latvians | 100.0 /100 | #27 | Exceptional 53.9% |
| Turks | 100.0 /100 | #28 | Exceptional 53.9% |
| Immigrants | France | 100.0 /100 | #29 | Exceptional 53.9% |
| Immigrants | Sri Lanka | 100.0 /100 | #30 | Exceptional 53.7% |
| Immigrants | Northern Europe | 100.0 /100 | #31 | Exceptional 53.5% |
| Immigrants | Turkey | 100.0 /100 | #32 | Exceptional 53.4% |
| Israelis | 100.0 /100 | #33 | Exceptional 53.4% |
| Bulgarians | 100.0 /100 | #34 | Exceptional 53.3% |
| Russians | 100.0 /100 | #35 | Exceptional 53.2% |
| Immigrants | Russia | 100.0 /100 | #36 | Exceptional 53.1% |