Argentinean vs Immigrants from Saudi Arabia Associate's Degree
COMPARE
Argentinean
Immigrants from Saudi Arabia
Associate's Degree
Associate's Degree Comparison
Argentineans
Immigrants from Saudi Arabia
51.2%
ASSOCIATE'S DEGREE
99.6/ 100
METRIC RATING
67th/ 347
METRIC RANK
52.6%
ASSOCIATE'S DEGREE
99.9/ 100
METRIC RATING
41st/ 347
METRIC RANK
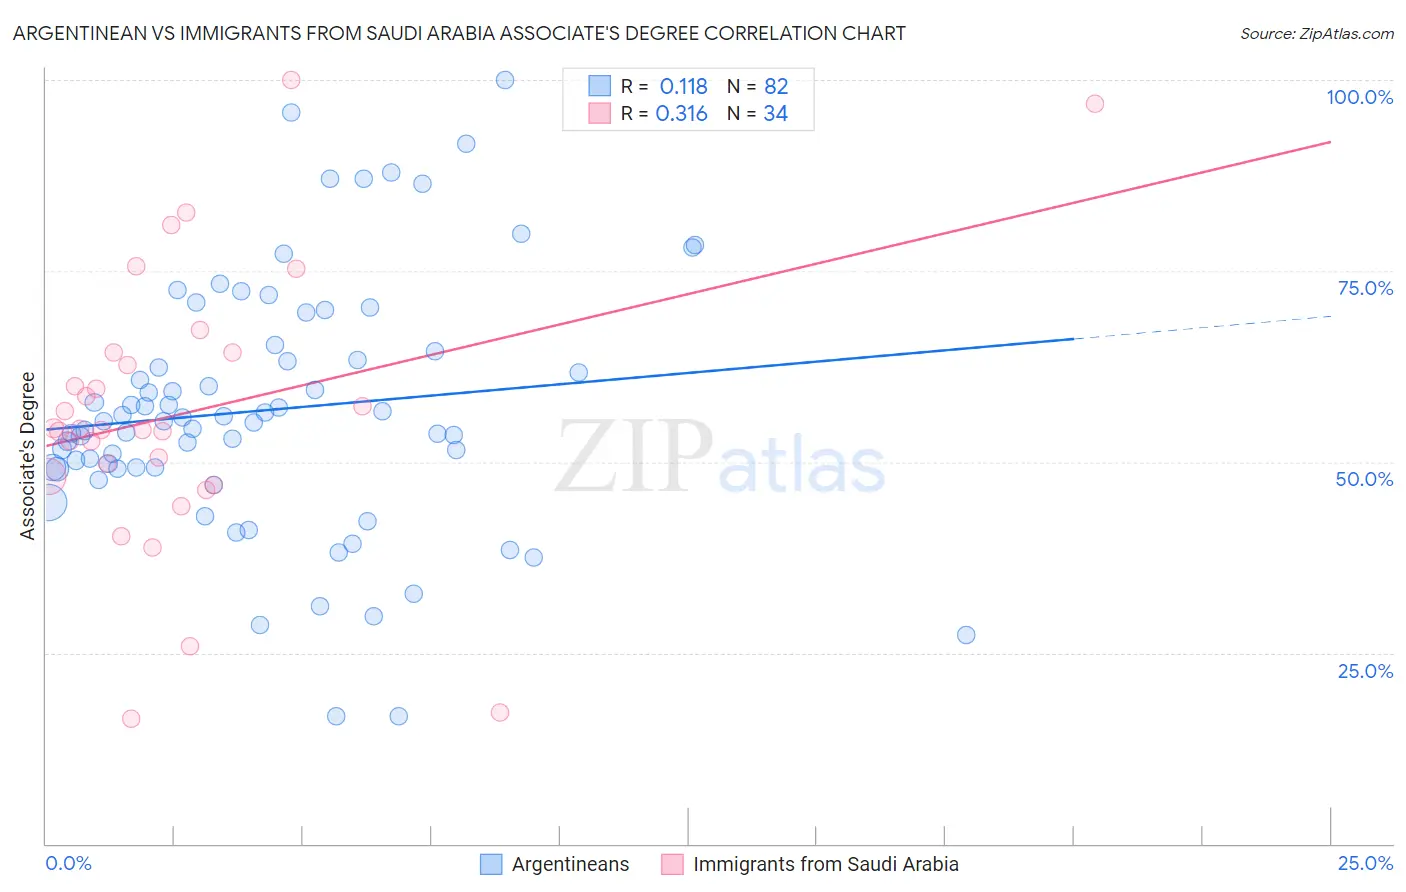
Argentinean vs Immigrants from Saudi Arabia Associate's Degree Correlation Chart
The statistical analysis conducted on geographies consisting of 297,131,671 people shows a poor positive correlation between the proportion of Argentineans and percentage of population with at least associate's degree education in the United States with a correlation coefficient (R) of 0.118 and weighted average of 51.2%. Similarly, the statistical analysis conducted on geographies consisting of 164,289,450 people shows a mild positive correlation between the proportion of Immigrants from Saudi Arabia and percentage of population with at least associate's degree education in the United States with a correlation coefficient (R) of 0.316 and weighted average of 52.6%, a difference of 2.5%.
Associate's Degree Correlation Summary
| Measurement | Argentinean | Immigrants from Saudi Arabia |
| Minimum | 16.7% | 16.3% |
| Maximum | 100.0% | 100.0% |
| Range | 83.3% | 83.7% |
| Mean | 56.8% | 56.4% |
| Median | 55.3% | 54.3% |
| Interquartile 25% (IQ1) | 49.2% | 48.1% |
| Interquartile 75% (IQ3) | 64.5% | 64.3% |
| Interquartile Range (IQR) | 15.4% | 16.2% |
| Standard Deviation (Sample) | 16.6% | 18.3% |
| Standard Deviation (Population) | 16.5% | 18.1% |
Similar Demographics by Associate's Degree
Demographics Similar to Argentineans by Associate's Degree
In terms of associate's degree, the demographic groups most similar to Argentineans are Immigrants from Europe (51.3%, a difference of 0.13%), Zimbabwean (51.3%, a difference of 0.18%), Immigrants from Netherlands (51.4%, a difference of 0.22%), South African (51.4%, a difference of 0.29%), and Bhutanese (51.4%, a difference of 0.34%).
| Demographics | Rating | Rank | Associate's Degree |
| Immigrants | Bolivia | 99.7 /100 | #60 | Exceptional 51.5% |
| Immigrants | Kazakhstan | 99.7 /100 | #61 | Exceptional 51.4% |
| Bhutanese | 99.7 /100 | #62 | Exceptional 51.4% |
| South Africans | 99.7 /100 | #63 | Exceptional 51.4% |
| Immigrants | Netherlands | 99.7 /100 | #64 | Exceptional 51.4% |
| Zimbabweans | 99.7 /100 | #65 | Exceptional 51.3% |
| Immigrants | Europe | 99.7 /100 | #66 | Exceptional 51.3% |
| Argentineans | 99.6 /100 | #67 | Exceptional 51.2% |
| Immigrants | Indonesia | 99.5 /100 | #68 | Exceptional 51.0% |
| Egyptians | 99.5 /100 | #69 | Exceptional 50.9% |
| Immigrants | Argentina | 99.5 /100 | #70 | Exceptional 50.9% |
| Immigrants | Romania | 99.5 /100 | #71 | Exceptional 50.9% |
| Immigrants | Pakistan | 99.5 /100 | #72 | Exceptional 50.9% |
| Carpatho Rusyns | 99.3 /100 | #73 | Exceptional 50.6% |
| Lithuanians | 99.3 /100 | #74 | Exceptional 50.6% |
Demographics Similar to Immigrants from Saudi Arabia by Associate's Degree
In terms of associate's degree, the demographic groups most similar to Immigrants from Saudi Arabia are Immigrants from Malaysia (52.5%, a difference of 0.030%), Immigrants from South Africa (52.5%, a difference of 0.040%), Estonian (52.5%, a difference of 0.13%), Immigrants from Lithuania (52.4%, a difference of 0.20%), and Immigrants from Bulgaria (52.4%, a difference of 0.34%).
| Demographics | Rating | Rank | Associate's Degree |
| Bulgarians | 100.0 /100 | #34 | Exceptional 53.3% |
| Russians | 100.0 /100 | #35 | Exceptional 53.2% |
| Immigrants | Russia | 100.0 /100 | #36 | Exceptional 53.1% |
| Immigrants | Denmark | 100.0 /100 | #37 | Exceptional 53.1% |
| Mongolians | 100.0 /100 | #38 | Exceptional 53.0% |
| Immigrants | Belarus | 99.9 /100 | #39 | Exceptional 52.8% |
| Immigrants | Latvia | 99.9 /100 | #40 | Exceptional 52.8% |
| Immigrants | Saudi Arabia | 99.9 /100 | #41 | Exceptional 52.6% |
| Immigrants | Malaysia | 99.9 /100 | #42 | Exceptional 52.5% |
| Immigrants | South Africa | 99.9 /100 | #43 | Exceptional 52.5% |
| Estonians | 99.9 /100 | #44 | Exceptional 52.5% |
| Immigrants | Lithuania | 99.9 /100 | #45 | Exceptional 52.4% |
| Immigrants | Bulgaria | 99.9 /100 | #46 | Exceptional 52.4% |
| Immigrants | Kuwait | 99.9 /100 | #47 | Exceptional 52.4% |
| Immigrants | Norway | 99.9 /100 | #48 | Exceptional 52.2% |