Argentinean vs Turkish No Schooling Completed
COMPARE
Argentinean
Turkish
No Schooling Completed
No Schooling Completed Comparison
Argentineans
Turks
2.1%
NO SCHOOLING COMPLETED
56.0/ 100
METRIC RATING
170th/ 347
METRIC RANK
1.8%
NO SCHOOLING COMPLETED
98.7/ 100
METRIC RATING
93rd/ 347
METRIC RANK
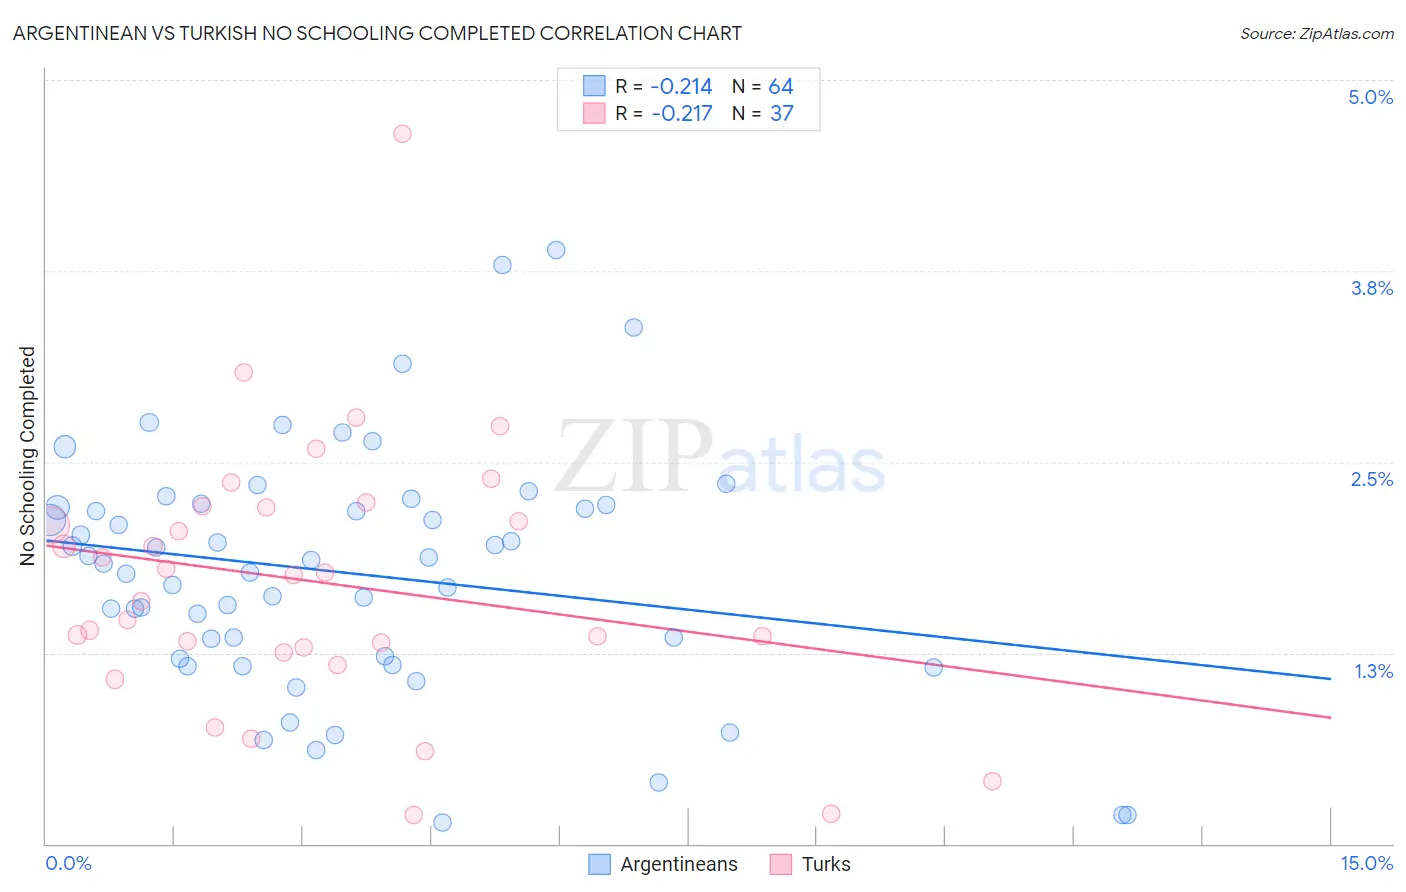
Argentinean vs Turkish No Schooling Completed Correlation Chart
The statistical analysis conducted on geographies consisting of 295,019,263 people shows a weak negative correlation between the proportion of Argentineans and percentage of population with no schooling in the United States with a correlation coefficient (R) of -0.214 and weighted average of 2.1%. Similarly, the statistical analysis conducted on geographies consisting of 270,038,657 people shows a weak negative correlation between the proportion of Turks and percentage of population with no schooling in the United States with a correlation coefficient (R) of -0.217 and weighted average of 1.8%, a difference of 16.0%.
No Schooling Completed Correlation Summary
| Measurement | Argentinean | Turkish |
| Minimum | 0.14% | 0.19% |
| Maximum | 3.9% | 4.7% |
| Range | 3.7% | 4.5% |
| Mean | 1.8% | 1.7% |
| Median | 1.8% | 1.8% |
| Interquartile 25% (IQ1) | 1.2% | 1.3% |
| Interquartile 75% (IQ3) | 2.2% | 2.2% |
| Interquartile Range (IQR) | 0.99% | 0.94% |
| Standard Deviation (Sample) | 0.79% | 0.87% |
| Standard Deviation (Population) | 0.79% | 0.86% |
Similar Demographics by No Schooling Completed
Demographics Similar to Argentineans by No Schooling Completed
In terms of no schooling completed, the demographic groups most similar to Argentineans are Apache (2.1%, a difference of 0.090%), Immigrants from Poland (2.1%, a difference of 0.11%), Cheyenne (2.1%, a difference of 0.36%), Egyptian (2.1%, a difference of 0.44%), and Immigrants from Argentina (2.1%, a difference of 0.45%).
| Demographics | Rating | Rank | No Schooling Completed |
| Albanians | 62.2 /100 | #163 | Good 2.1% |
| Comanche | 60.7 /100 | #164 | Good 2.1% |
| Brazilians | 60.2 /100 | #165 | Good 2.1% |
| Dutch West Indians | 59.9 /100 | #166 | Average 2.1% |
| Egyptians | 59.2 /100 | #167 | Average 2.1% |
| Cheyenne | 58.6 /100 | #168 | Average 2.1% |
| Apache | 56.7 /100 | #169 | Average 2.1% |
| Argentineans | 56.0 /100 | #170 | Average 2.1% |
| Immigrants | Poland | 55.2 /100 | #171 | Average 2.1% |
| Immigrants | Argentina | 52.7 /100 | #172 | Average 2.1% |
| Immigrants | Belarus | 51.8 /100 | #173 | Average 2.1% |
| Immigrants | Micronesia | 50.0 /100 | #174 | Average 2.1% |
| Arabs | 46.4 /100 | #175 | Average 2.1% |
| Panamanians | 45.2 /100 | #176 | Average 2.1% |
| Arapaho | 45.0 /100 | #177 | Average 2.1% |
Demographics Similar to Turks by No Schooling Completed
In terms of no schooling completed, the demographic groups most similar to Turks are Romanian (1.8%, a difference of 0.37%), Nonimmigrants (1.8%, a difference of 0.50%), Puget Sound Salish (1.8%, a difference of 0.51%), Bhutanese (1.8%, a difference of 0.74%), and Immigrants from Germany (1.8%, a difference of 0.89%).
| Demographics | Rating | Rank | No Schooling Completed |
| Ukrainians | 99.2 /100 | #86 | Exceptional 1.8% |
| Osage | 99.2 /100 | #87 | Exceptional 1.8% |
| Immigrants | Western Europe | 99.2 /100 | #88 | Exceptional 1.8% |
| South Africans | 99.1 /100 | #89 | Exceptional 1.8% |
| Sioux | 99.0 /100 | #90 | Exceptional 1.8% |
| Immigrants | Germany | 99.0 /100 | #91 | Exceptional 1.8% |
| Romanians | 98.8 /100 | #92 | Exceptional 1.8% |
| Turks | 98.7 /100 | #93 | Exceptional 1.8% |
| Immigrants | Nonimmigrants | 98.5 /100 | #94 | Exceptional 1.8% |
| Puget Sound Salish | 98.5 /100 | #95 | Exceptional 1.8% |
| Bhutanese | 98.4 /100 | #96 | Exceptional 1.8% |
| Immigrants | Ireland | 98.4 /100 | #97 | Exceptional 1.8% |
| Iranians | 98.2 /100 | #98 | Exceptional 1.8% |
| Choctaw | 98.1 /100 | #99 | Exceptional 1.8% |
| Immigrants | Singapore | 98.0 /100 | #100 | Exceptional 1.8% |