Houma vs Cape Verdean Nursery School
COMPARE
Houma
Cape Verdean
Nursery School
Nursery School Comparison
Houma
Cape Verdeans
97.3%
NURSERY SCHOOL
0.0/ 100
METRIC RATING
292nd/ 347
METRIC RANK
97.0%
NURSERY SCHOOL
0.0/ 100
METRIC RATING
314th/ 347
METRIC RANK
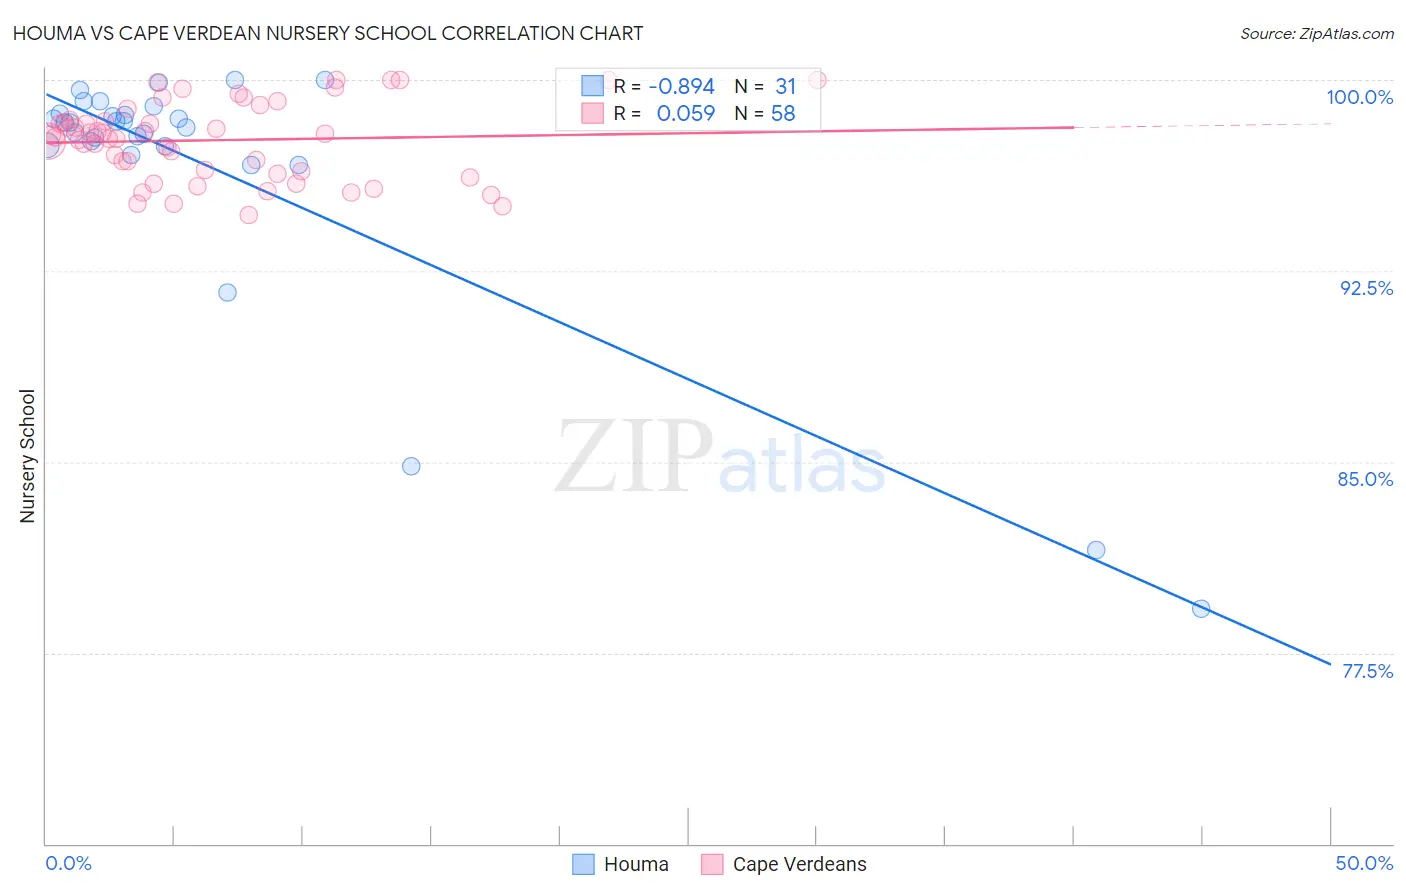
Houma vs Cape Verdean Nursery School Correlation Chart
The statistical analysis conducted on geographies consisting of 36,795,916 people shows a very strong negative correlation between the proportion of Houma and percentage of population with at least nursery school education in the United States with a correlation coefficient (R) of -0.894 and weighted average of 97.3%. Similarly, the statistical analysis conducted on geographies consisting of 107,537,955 people shows a slight positive correlation between the proportion of Cape Verdeans and percentage of population with at least nursery school education in the United States with a correlation coefficient (R) of 0.059 and weighted average of 97.0%, a difference of 0.33%.
Nursery School Correlation Summary
| Measurement | Houma | Cape Verdean |
| Minimum | 79.2% | 94.7% |
| Maximum | 100.0% | 100.0% |
| Range | 20.8% | 5.3% |
| Mean | 96.5% | 97.6% |
| Median | 98.3% | 97.8% |
| Interquartile 25% (IQ1) | 97.4% | 96.4% |
| Interquartile 75% (IQ3) | 98.7% | 98.4% |
| Interquartile Range (IQR) | 1.3% | 2.0% |
| Standard Deviation (Sample) | 5.2% | 1.5% |
| Standard Deviation (Population) | 5.1% | 1.5% |
Similar Demographics by Nursery School
Demographics Similar to Houma by Nursery School
In terms of nursery school, the demographic groups most similar to Houma are Malaysian (97.3%, a difference of 0.010%), British West Indian (97.3%, a difference of 0.020%), Immigrants from Grenada (97.3%, a difference of 0.020%), Immigrants (97.2%, a difference of 0.030%), and Immigrants from Eritrea (97.2%, a difference of 0.040%).
| Demographics | Rating | Rank | Nursery School |
| Immigrants | Barbados | 0.0 /100 | #285 | Tragic 97.4% |
| Immigrants | Portugal | 0.0 /100 | #286 | Tragic 97.4% |
| Immigrants | Hong Kong | 0.0 /100 | #287 | Tragic 97.4% |
| Immigrants | Thailand | 0.0 /100 | #288 | Tragic 97.3% |
| Immigrants | St. Vincent and the Grenadines | 0.0 /100 | #289 | Tragic 97.3% |
| Immigrants | Afghanistan | 0.0 /100 | #290 | Tragic 97.3% |
| British West Indians | 0.0 /100 | #291 | Tragic 97.3% |
| Houma | 0.0 /100 | #292 | Tragic 97.3% |
| Malaysians | 0.0 /100 | #293 | Tragic 97.3% |
| Immigrants | Grenada | 0.0 /100 | #294 | Tragic 97.3% |
| Immigrants | Immigrants | 0.0 /100 | #295 | Tragic 97.2% |
| Immigrants | Eritrea | 0.0 /100 | #296 | Tragic 97.2% |
| Immigrants | Cuba | 0.0 /100 | #297 | Tragic 97.2% |
| Central American Indians | 0.0 /100 | #298 | Tragic 97.2% |
| Immigrants | Dominica | 0.0 /100 | #299 | Tragic 97.2% |
Demographics Similar to Cape Verdeans by Nursery School
In terms of nursery school, the demographic groups most similar to Cape Verdeans are Immigrants from Nicaragua (96.9%, a difference of 0.0%), Immigrants from Belize (96.9%, a difference of 0.0%), Honduran (97.0%, a difference of 0.010%), Immigrants from Ecuador (96.9%, a difference of 0.010%), and Guyanese (97.0%, a difference of 0.030%).
| Demographics | Rating | Rank | Nursery School |
| Hispanics or Latinos | 0.0 /100 | #307 | Tragic 97.0% |
| Immigrants | Haiti | 0.0 /100 | #308 | Tragic 97.0% |
| Immigrants | Somalia | 0.0 /100 | #309 | Tragic 97.0% |
| Guyanese | 0.0 /100 | #310 | Tragic 97.0% |
| Immigrants | Azores | 0.0 /100 | #311 | Tragic 97.0% |
| Sri Lankans | 0.0 /100 | #312 | Tragic 97.0% |
| Hondurans | 0.0 /100 | #313 | Tragic 97.0% |
| Cape Verdeans | 0.0 /100 | #314 | Tragic 97.0% |
| Immigrants | Nicaragua | 0.0 /100 | #315 | Tragic 96.9% |
| Immigrants | Belize | 0.0 /100 | #316 | Tragic 96.9% |
| Immigrants | Ecuador | 0.0 /100 | #317 | Tragic 96.9% |
| Immigrants | Guyana | 0.0 /100 | #318 | Tragic 96.9% |
| Immigrants | Laos | 0.0 /100 | #319 | Tragic 96.9% |
| Immigrants | Burma/Myanmar | 0.0 /100 | #320 | Tragic 96.9% |
| Immigrants | Bangladesh | 0.0 /100 | #321 | Tragic 96.9% |