Immigrants from Dominican Republic vs Cape Verdean Nursery School
COMPARE
Immigrants from Dominican Republic
Cape Verdean
Nursery School
Nursery School Comparison
Immigrants from Dominican Republic
Cape Verdeans
96.6%
NURSERY SCHOOL
0.0/ 100
METRIC RATING
334th/ 347
METRIC RANK
97.0%
NURSERY SCHOOL
0.0/ 100
METRIC RATING
314th/ 347
METRIC RANK
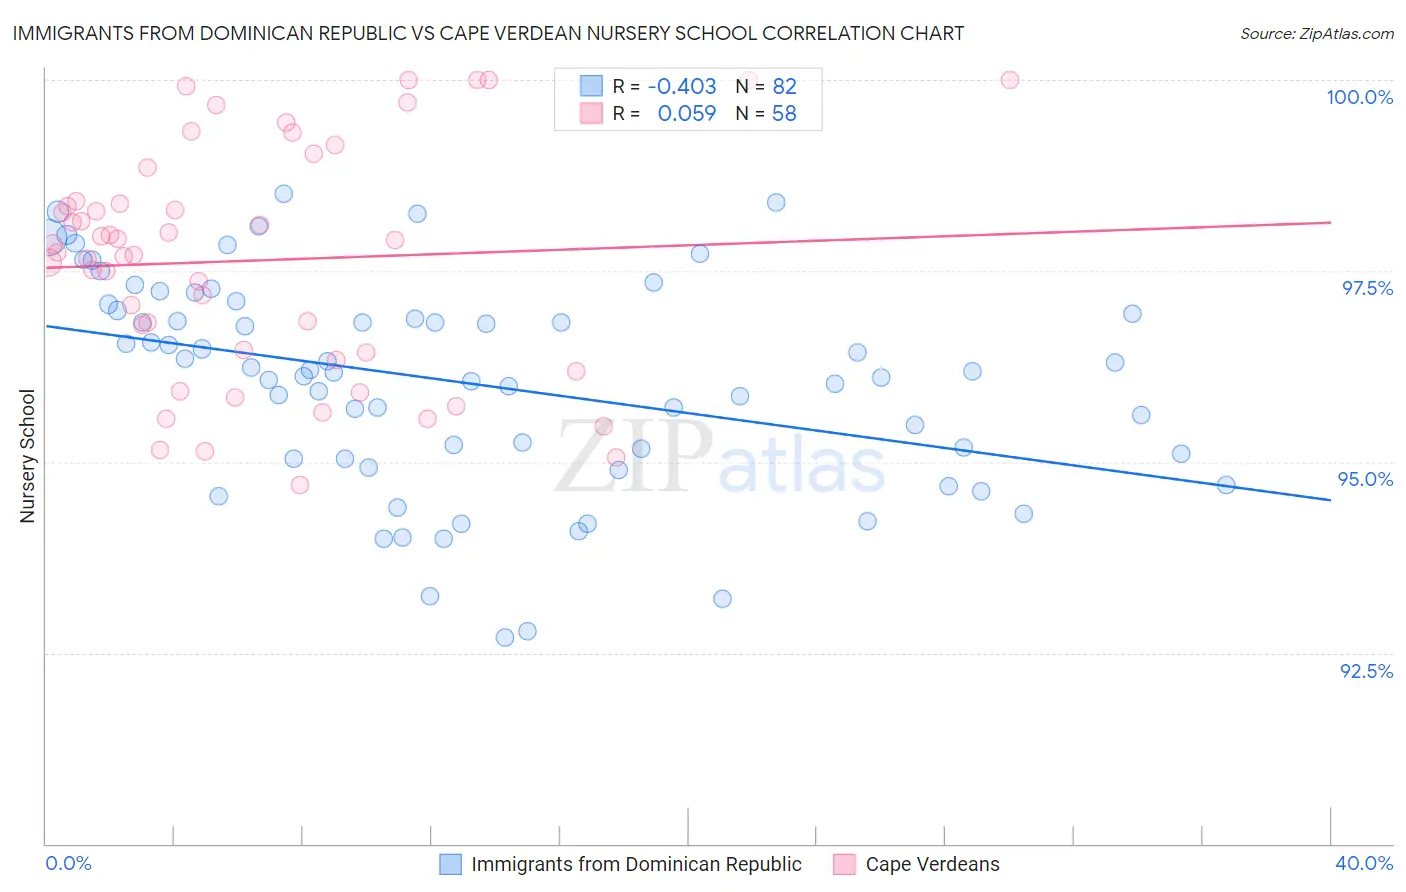
Immigrants from Dominican Republic vs Cape Verdean Nursery School Correlation Chart
The statistical analysis conducted on geographies consisting of 275,142,551 people shows a moderate negative correlation between the proportion of Immigrants from Dominican Republic and percentage of population with at least nursery school education in the United States with a correlation coefficient (R) of -0.403 and weighted average of 96.6%. Similarly, the statistical analysis conducted on geographies consisting of 107,537,955 people shows a slight positive correlation between the proportion of Cape Verdeans and percentage of population with at least nursery school education in the United States with a correlation coefficient (R) of 0.059 and weighted average of 97.0%, a difference of 0.35%.
Nursery School Correlation Summary
| Measurement | Immigrants from Dominican Republic | Cape Verdean |
| Minimum | 92.7% | 94.7% |
| Maximum | 98.5% | 100.0% |
| Range | 5.8% | 5.3% |
| Mean | 96.0% | 97.6% |
| Median | 96.2% | 97.8% |
| Interquartile 25% (IQ1) | 95.0% | 96.4% |
| Interquartile 75% (IQ3) | 97.0% | 98.4% |
| Interquartile Range (IQR) | 1.9% | 2.0% |
| Standard Deviation (Sample) | 1.4% | 1.5% |
| Standard Deviation (Population) | 1.4% | 1.5% |
Demographics Similar to Immigrants from Dominican Republic and Cape Verdeans by Nursery School
In terms of nursery school, the demographic groups most similar to Immigrants from Dominican Republic are Central American (96.6%, a difference of 0.010%), Yakama (96.6%, a difference of 0.030%), Immigrants from Armenia (96.7%, a difference of 0.050%), Japanese (96.7%, a difference of 0.070%), and Immigrants from Vietnam (96.7%, a difference of 0.080%). Similarly, the demographic groups most similar to Cape Verdeans are Immigrants from Nicaragua (96.9%, a difference of 0.0%), Immigrants from Belize (96.9%, a difference of 0.0%), Immigrants from Ecuador (96.9%, a difference of 0.010%), Immigrants from Guyana (96.9%, a difference of 0.060%), and Immigrants from Laos (96.9%, a difference of 0.080%).
| Demographics | Rating | Rank | Nursery School |
| Cape Verdeans | 0.0 /100 | #314 | Tragic 97.0% |
| Immigrants | Nicaragua | 0.0 /100 | #315 | Tragic 96.9% |
| Immigrants | Belize | 0.0 /100 | #316 | Tragic 96.9% |
| Immigrants | Ecuador | 0.0 /100 | #317 | Tragic 96.9% |
| Immigrants | Guyana | 0.0 /100 | #318 | Tragic 96.9% |
| Immigrants | Laos | 0.0 /100 | #319 | Tragic 96.9% |
| Immigrants | Burma/Myanmar | 0.0 /100 | #320 | Tragic 96.9% |
| Immigrants | Bangladesh | 0.0 /100 | #321 | Tragic 96.9% |
| Mexican American Indians | 0.0 /100 | #322 | Tragic 96.9% |
| Immigrants | Honduras | 0.0 /100 | #323 | Tragic 96.9% |
| Vietnamese | 0.0 /100 | #324 | Tragic 96.8% |
| Dominicans | 0.0 /100 | #325 | Tragic 96.8% |
| Indonesians | 0.0 /100 | #326 | Tragic 96.8% |
| Mexicans | 0.0 /100 | #327 | Tragic 96.8% |
| Immigrants | Latin America | 0.0 /100 | #328 | Tragic 96.7% |
| Immigrants | Vietnam | 0.0 /100 | #329 | Tragic 96.7% |
| Japanese | 0.0 /100 | #330 | Tragic 96.7% |
| Immigrants | Armenia | 0.0 /100 | #331 | Tragic 96.7% |
| Yakama | 0.0 /100 | #332 | Tragic 96.6% |
| Central Americans | 0.0 /100 | #333 | Tragic 96.6% |
| Immigrants | Dominican Republic | 0.0 /100 | #334 | Tragic 96.6% |