Immigrants from Eastern Asia vs Nepalese College, Under 1 year
COMPARE
Immigrants from Eastern Asia
Nepalese
College, Under 1 year
College, Under 1 year Comparison
Immigrants from Eastern Asia
Nepalese
71.3%
COLLEGE, UNDER 1 YEAR
100.0/ 100
METRIC RATING
22nd/ 347
METRIC RANK
62.2%
COLLEGE, UNDER 1 YEAR
1.1/ 100
METRIC RATING
239th/ 347
METRIC RANK
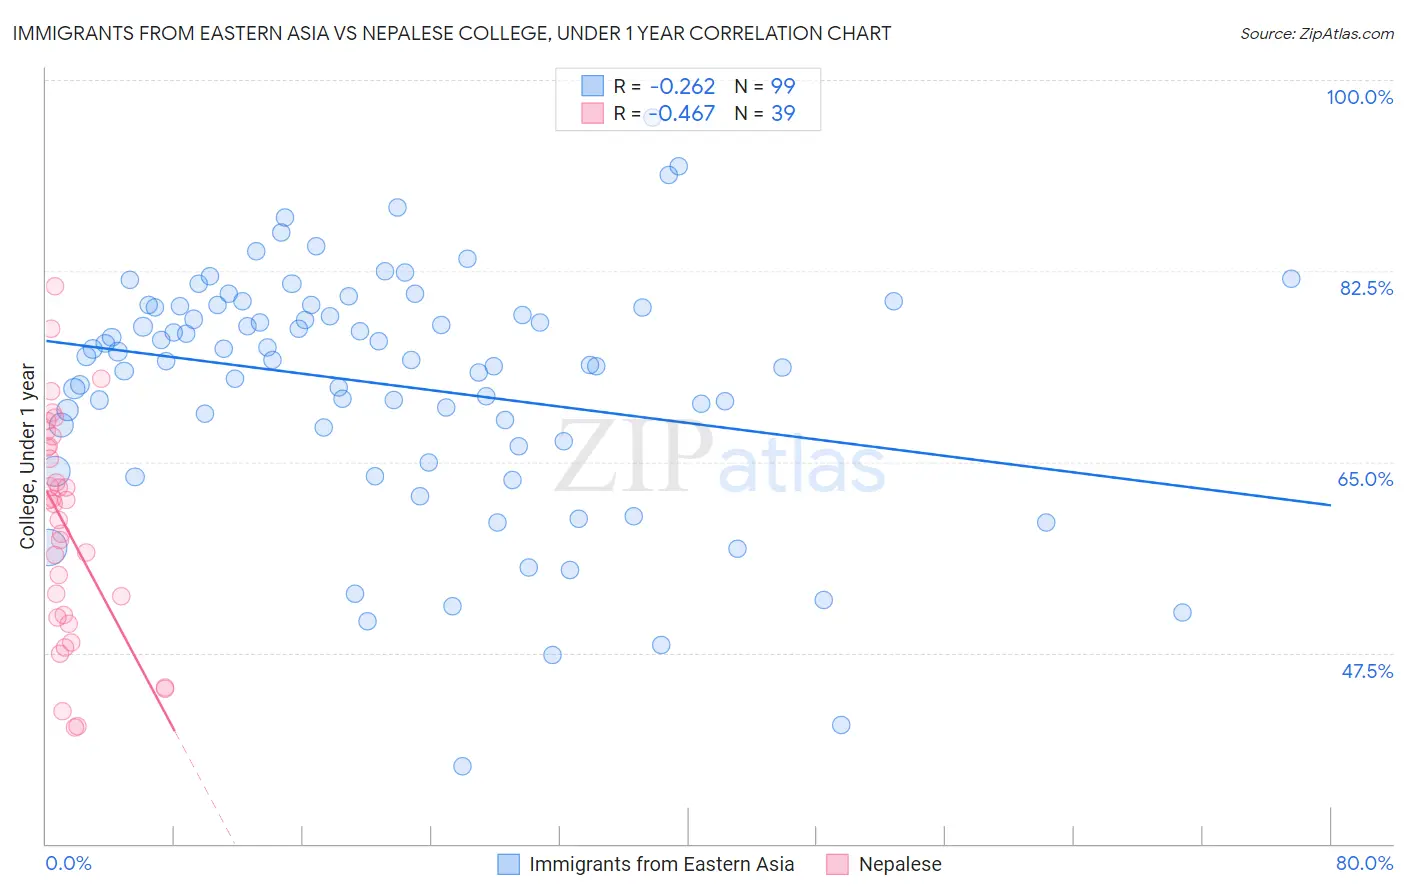
Immigrants from Eastern Asia vs Nepalese College, Under 1 year Correlation Chart
The statistical analysis conducted on geographies consisting of 499,935,420 people shows a weak negative correlation between the proportion of Immigrants from Eastern Asia and percentage of population with at least college, under 1 year education in the United States with a correlation coefficient (R) of -0.262 and weighted average of 71.3%. Similarly, the statistical analysis conducted on geographies consisting of 24,519,269 people shows a moderate negative correlation between the proportion of Nepalese and percentage of population with at least college, under 1 year education in the United States with a correlation coefficient (R) of -0.467 and weighted average of 62.2%, a difference of 14.6%.
College, Under 1 year Correlation Summary
| Measurement | Immigrants from Eastern Asia | Nepalese |
| Minimum | 37.2% | 40.7% |
| Maximum | 96.6% | 81.1% |
| Range | 59.5% | 40.5% |
| Mean | 72.1% | 58.9% |
| Median | 74.4% | 61.2% |
| Interquartile 25% (IQ1) | 66.9% | 50.7% |
| Interquartile 75% (IQ3) | 79.2% | 66.4% |
| Interquartile Range (IQR) | 12.4% | 15.7% |
| Standard Deviation (Sample) | 11.1% | 10.2% |
| Standard Deviation (Population) | 11.0% | 10.0% |
Similar Demographics by College, Under 1 year
Demographics Similar to Immigrants from Eastern Asia by College, Under 1 year
In terms of college, under 1 year, the demographic groups most similar to Immigrants from Eastern Asia are Immigrants from Northern Europe (71.1%, a difference of 0.23%), Soviet Union (71.1%, a difference of 0.24%), Immigrants from Belgium (71.5%, a difference of 0.25%), Bulgarian (71.1%, a difference of 0.25%), and Immigrants from Denmark (71.0%, a difference of 0.37%).
| Demographics | Rating | Rank | College, Under 1 year |
| Burmese | 100.0 /100 | #15 | Exceptional 71.9% |
| Immigrants | Japan | 100.0 /100 | #16 | Exceptional 71.9% |
| Eastern Europeans | 100.0 /100 | #17 | Exceptional 71.8% |
| Immigrants | Switzerland | 100.0 /100 | #18 | Exceptional 71.7% |
| Latvians | 100.0 /100 | #19 | Exceptional 71.6% |
| Immigrants | Korea | 100.0 /100 | #20 | Exceptional 71.6% |
| Immigrants | Belgium | 100.0 /100 | #21 | Exceptional 71.5% |
| Immigrants | Eastern Asia | 100.0 /100 | #22 | Exceptional 71.3% |
| Immigrants | Northern Europe | 100.0 /100 | #23 | Exceptional 71.1% |
| Soviet Union | 100.0 /100 | #24 | Exceptional 71.1% |
| Bulgarians | 100.0 /100 | #25 | Exceptional 71.1% |
| Immigrants | Denmark | 100.0 /100 | #26 | Exceptional 71.0% |
| Immigrants | Ireland | 100.0 /100 | #27 | Exceptional 71.0% |
| Immigrants | Hong Kong | 100.0 /100 | #28 | Exceptional 71.0% |
| Immigrants | France | 100.0 /100 | #29 | Exceptional 71.0% |
Demographics Similar to Nepalese by College, Under 1 year
In terms of college, under 1 year, the demographic groups most similar to Nepalese are Aleut (62.2%, a difference of 0.0%), Ottawa (62.2%, a difference of 0.010%), Malaysian (62.2%, a difference of 0.060%), Hawaiian (62.1%, a difference of 0.090%), and Colville (62.1%, a difference of 0.18%).
| Demographics | Rating | Rank | College, Under 1 year |
| Osage | 2.2 /100 | #232 | Tragic 62.7% |
| Iroquois | 2.0 /100 | #233 | Tragic 62.6% |
| Chippewa | 2.0 /100 | #234 | Tragic 62.6% |
| Spanish Americans | 1.9 /100 | #235 | Tragic 62.6% |
| Immigrants | Immigrants | 1.7 /100 | #236 | Tragic 62.5% |
| Immigrants | Burma/Myanmar | 1.6 /100 | #237 | Tragic 62.5% |
| French American Indians | 1.5 /100 | #238 | Tragic 62.4% |
| Nepalese | 1.1 /100 | #239 | Tragic 62.2% |
| Aleuts | 1.1 /100 | #240 | Tragic 62.2% |
| Ottawa | 1.1 /100 | #241 | Tragic 62.2% |
| Malaysians | 1.1 /100 | #242 | Tragic 62.2% |
| Hawaiians | 1.1 /100 | #243 | Tragic 62.1% |
| Colville | 1.0 /100 | #244 | Tragic 62.1% |
| Delaware | 0.9 /100 | #245 | Tragic 62.1% |
| Marshallese | 0.8 /100 | #246 | Tragic 61.9% |