Tsimshian vs Immigrants from Middle Africa Associate's Degree
COMPARE
Tsimshian
Immigrants from Middle Africa
Associate's Degree
Associate's Degree Comparison
Tsimshian
Immigrants from Middle Africa
38.6%
ASSOCIATE'S DEGREE
0.0/ 100
METRIC RATING
301st/ 347
METRIC RANK
44.7%
ASSOCIATE'S DEGREE
12.7/ 100
METRIC RATING
214th/ 347
METRIC RANK
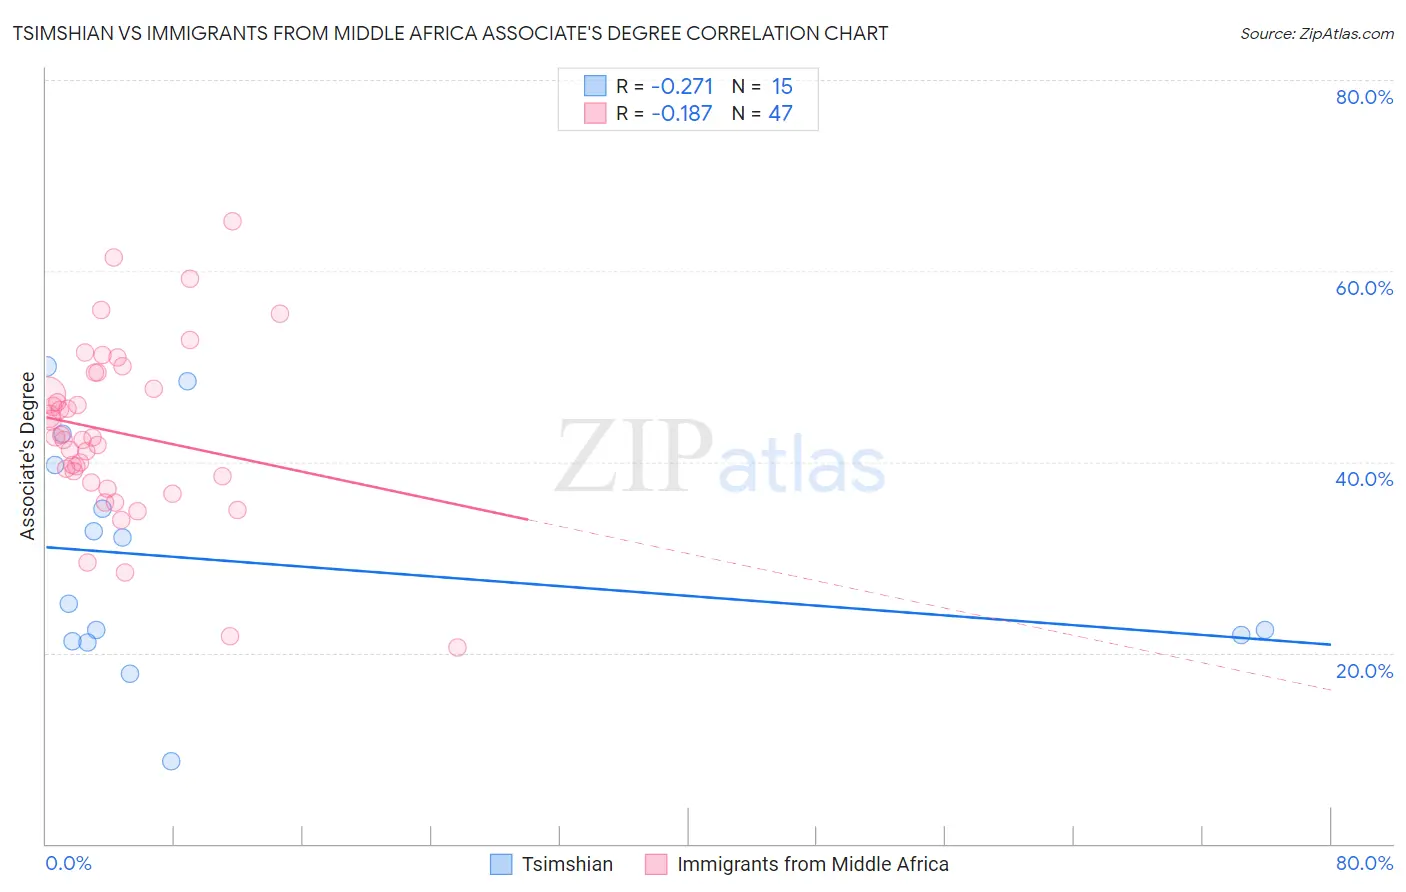
Tsimshian vs Immigrants from Middle Africa Associate's Degree Correlation Chart
The statistical analysis conducted on geographies consisting of 15,626,544 people shows a weak negative correlation between the proportion of Tsimshian and percentage of population with at least associate's degree education in the United States with a correlation coefficient (R) of -0.271 and weighted average of 38.6%. Similarly, the statistical analysis conducted on geographies consisting of 202,743,953 people shows a poor negative correlation between the proportion of Immigrants from Middle Africa and percentage of population with at least associate's degree education in the United States with a correlation coefficient (R) of -0.187 and weighted average of 44.7%, a difference of 15.8%.
Associate's Degree Correlation Summary
| Measurement | Tsimshian | Immigrants from Middle Africa |
| Minimum | 8.6% | 20.5% |
| Maximum | 50.0% | 65.2% |
| Range | 41.4% | 44.7% |
| Mean | 29.4% | 43.1% |
| Median | 25.2% | 42.6% |
| Interquartile 25% (IQ1) | 21.2% | 37.8% |
| Interquartile 75% (IQ3) | 39.6% | 49.3% |
| Interquartile Range (IQR) | 18.4% | 11.5% |
| Standard Deviation (Sample) | 12.0% | 9.1% |
| Standard Deviation (Population) | 11.5% | 9.0% |
Similar Demographics by Associate's Degree
Demographics Similar to Tsimshian by Associate's Degree
In terms of associate's degree, the demographic groups most similar to Tsimshian are Chickasaw (38.6%, a difference of 0.060%), Ute (38.6%, a difference of 0.090%), Colville (38.5%, a difference of 0.15%), Cheyenne (38.7%, a difference of 0.19%), and Guatemalan (38.5%, a difference of 0.24%).
| Demographics | Rating | Rank | Associate's Degree |
| Salvadorans | 0.0 /100 | #294 | Tragic 39.0% |
| Hondurans | 0.0 /100 | #295 | Tragic 38.9% |
| Cherokee | 0.0 /100 | #296 | Tragic 38.9% |
| Cape Verdeans | 0.0 /100 | #297 | Tragic 38.8% |
| Cheyenne | 0.0 /100 | #298 | Tragic 38.7% |
| Ute | 0.0 /100 | #299 | Tragic 38.6% |
| Chickasaw | 0.0 /100 | #300 | Tragic 38.6% |
| Tsimshian | 0.0 /100 | #301 | Tragic 38.6% |
| Colville | 0.0 /100 | #302 | Tragic 38.5% |
| Guatemalans | 0.0 /100 | #303 | Tragic 38.5% |
| Sioux | 0.0 /100 | #304 | Tragic 38.5% |
| Immigrants | Honduras | 0.0 /100 | #305 | Tragic 38.5% |
| Shoshone | 0.0 /100 | #306 | Tragic 38.4% |
| Immigrants | El Salvador | 0.0 /100 | #307 | Tragic 38.4% |
| Mexican American Indians | 0.0 /100 | #308 | Tragic 38.2% |
Demographics Similar to Immigrants from Middle Africa by Associate's Degree
In terms of associate's degree, the demographic groups most similar to Immigrants from Middle Africa are Immigrants from Panama (44.7%, a difference of 0.060%), Immigrants from Nigeria (44.6%, a difference of 0.24%), Immigrants from Ghana (44.8%, a difference of 0.25%), French Canadian (44.9%, a difference of 0.38%), and Immigrants (44.5%, a difference of 0.42%).
| Demographics | Rating | Rank | Associate's Degree |
| Panamanians | 18.4 /100 | #207 | Poor 45.1% |
| Dutch | 17.6 /100 | #208 | Poor 45.0% |
| Immigrants | Costa Rica | 16.7 /100 | #209 | Poor 45.0% |
| Immigrants | Philippines | 16.7 /100 | #210 | Poor 45.0% |
| Immigrants | Zaire | 16.6 /100 | #211 | Poor 45.0% |
| French Canadians | 15.0 /100 | #212 | Poor 44.9% |
| Immigrants | Ghana | 14.2 /100 | #213 | Poor 44.8% |
| Immigrants | Middle Africa | 12.7 /100 | #214 | Poor 44.7% |
| Immigrants | Panama | 12.4 /100 | #215 | Poor 44.7% |
| Immigrants | Nigeria | 11.4 /100 | #216 | Poor 44.6% |
| Immigrants | Immigrants | 10.5 /100 | #217 | Poor 44.5% |
| Spanish | 9.4 /100 | #218 | Tragic 44.4% |
| Whites/Caucasians | 7.5 /100 | #219 | Tragic 44.2% |
| Portuguese | 7.2 /100 | #220 | Tragic 44.1% |
| Immigrants | Western Africa | 6.6 /100 | #221 | Tragic 44.1% |