Arapaho vs Immigrants from Thailand Professional Degree

COMPARE

Arapaho
Race
Ancestry
AfghanAfricanAlaska NativeAlaskan AthabascanAlbanianAleutAlsatianAmericanApacheArabArapahoArgentineanArmenianAssyrian/Chaldean/SyriacAustralianAustrianBahamianBangladeshiBarbadianBasqueBelgianBelizeanBermudanBhutaneseBlackfeetBolivianBrazilianBritishBritish West IndianBulgarianBurmeseCajunCambodianCanadianCape VerdeanCarpatho RusynCelticCentral AmericanCentral American IndianCherokeeCheyenneChickasawChileanChineseChippewaChoctawColombianColvilleComancheCosta RicanCreeCreekCroatianCrowCubanCypriotCzechCzechoslovakianDanishDelawareDominicanDutchDutch West IndianEastern EuropeanEcuadorianEgyptianEnglishEstonianEthiopianEuropeanFijianFilipinoFinnishFrenchFrench American IndianFrench CanadianGermanGerman RussianGhanaianGreekGuamanian/ChamorroGuatemalanGuyaneseHaitianHmongHonduranHopiHoumaHungarianIcelanderIndian (Asian)IndonesianInupiatIranianIraqiIrishIroquoisIsraeliItalianJamaicanJapaneseJordanianKenyanKiowaKoreanLaotianLatvianLebaneseLiberianLithuanianLumbeeLuxembourgerMacedonianMalaysianMalteseMarshalleseMenomineeMexicanMexican American IndianMongolianMoroccanNative HawaiianNavajoNepaleseNew ZealanderNicaraguanNigerianNorthern EuropeanNorwegianOkinawanOsageOttawaPaiutePakistaniPalestinianPanamanianParaguayanPennsylvania GermanPeruvianPimaPolishPortuguesePotawatomiPuebloPuerto RicanPuget Sound SalishRomanianRussianSalvadoranSamoanScandinavianScotch-IrishScottishSeminoleSenegaleseSerbianShoshoneSierra LeoneanSiouxSlavicSlovakSloveneSomaliSouth AfricanSouth AmericanSouth American IndianSoviet UnionSpaniardSpanishSpanish AmericanSpanish American IndianSri LankanSubsaharan AfricanSudaneseSwedishSwissSyrianTaiwaneseThaiTlingit-HaidaTohono O'OdhamTonganTrinidadian and TobagonianTsimshianTurkishU.S. Virgin IslanderUgandanUkrainianUruguayanUteVenezuelanVietnameseWelshWest IndianYakamaYaquiYugoslavianYumanYup'ikZimbabwean
Immigration
NonimmigrantsImmigrantsAfghanistanAfricaAlbaniaArgentinaArmeniaAsiaAustraliaAustriaBahamasBangladeshBarbadosBelarusBelgiumBelizeBoliviaBosnia and HerzegovinaBrazilBulgariaBurma/MyanmarCabo VerdeCambodiaCameroonCanadaCaribbeanCentral AmericaChileChinaColombiaCongoCosta RicaCroatiaCubaCzechoslovakiaDenmarkDominicaDominican RepublicEastern AfricaEastern AsiaEastern EuropeEcuadorEgyptEl SalvadorEnglandEritreaEthiopiaEuropeFijiFranceGermanyGhanaGreeceGrenadaGuatemalaGuyanaHaitiHondurasHong KongHungaryIndiaIndonesiaIranIraqIrelandIsraelItalyJamaicaJapanJordanKazakhstanKenyaKoreaKuwaitLaosLatin AmericaLatviaLebanonLiberiaLithuaniaMalaysiaMexicoMicronesiaMiddle AfricaMoldovaMoroccoNepalNetherlandsNicaraguaNigeriaNorth AmericaNorth MacedoniaNorthern AfricaNorthern EuropeNorwayOceaniaPakistanPanamaPeruPhilippinesPolandPortugalRomaniaRussiaSaudi ArabiaScotlandSenegalSerbiaSierra LeoneSingaporeSomaliaSouth AfricaSouth AmericaSouth Central AsiaSouth Eastern AsiaSouthern EuropeSpainSri LankaSt. Vincent and the GrenadinesSudanSwedenSwitzerlandSyriaTaiwanTrinidad and TobagoTurkeyUgandaUkraineUruguayUzbekistanVenezuelaVietnamWest IndiesWestern AfricaWestern AsiaWestern EuropeYemenZaireZimbabweAzores
Immigrants from Thailand
Race
Ancestry
AfghanAfricanAlaska NativeAlaskan AthabascanAlbanianAleutAlsatianAmericanApacheArabArgentineanArmenianAssyrian/Chaldean/SyriacAustralianAustrianBahamianBangladeshiBarbadianBasqueBelgianBelizeanBermudanBhutaneseBlackfeetBolivianBrazilianBritishBritish West IndianBulgarianBurmeseCajunCambodianCanadianCape VerdeanCarpatho RusynCelticCentral AmericanCentral American IndianCherokeeCheyenneChickasawChileanChineseChippewaChoctawColombianColvilleComancheCosta RicanCreeCreekCroatianCrowCubanCypriotCzechCzechoslovakianDanishDelawareDominicanDutchDutch West IndianEastern EuropeanEcuadorianEgyptianEnglishEstonianEthiopianEuropeanFijianFilipinoFinnishFrenchFrench American IndianFrench CanadianGermanGerman RussianGhanaianGreekGuamanian/ChamorroGuatemalanGuyaneseHaitianHmongHonduranHopiHoumaHungarianIcelanderIndian (Asian)IndonesianInupiatIranianIraqiIrishIroquoisIsraeliItalianJamaicanJapaneseJordanianKenyanKiowaKoreanLaotianLatvianLebaneseLiberianLithuanianLumbeeLuxembourgerMacedonianMalaysianMalteseMarshalleseMenomineeMexicanMexican American IndianMongolianMoroccanNative HawaiianNavajoNepaleseNew ZealanderNicaraguanNigerianNorthern EuropeanNorwegianOkinawanOsageOttawaPaiutePakistaniPalestinianPanamanianParaguayanPennsylvania GermanPeruvianPimaPolishPortuguesePotawatomiPuebloPuerto RicanPuget Sound SalishRomanianRussianSalvadoranSamoanScandinavianScotch-IrishScottishSeminoleSenegaleseSerbianShoshoneSierra LeoneanSiouxSlavicSlovakSloveneSomaliSouth AfricanSouth AmericanSouth American IndianSoviet UnionSpaniardSpanishSpanish AmericanSpanish American IndianSri LankanSubsaharan AfricanSudaneseSwedishSwissSyrianTaiwaneseThaiTlingit-HaidaTohono O'OdhamTonganTrinidadian and TobagonianTsimshianTurkishU.S. Virgin IslanderUgandanUkrainianUruguayanUteVenezuelanVietnameseWelshWest IndianYakamaYaquiYugoslavianYumanYup'ikZimbabwean
Immigration
NonimmigrantsImmigrantsAfghanistanAfricaAlbaniaArgentinaArmeniaAsiaAustraliaAustriaBahamasBangladeshBarbadosBelarusBelgiumBelizeBoliviaBosnia and HerzegovinaBrazilBulgariaBurma/MyanmarCabo VerdeCambodiaCameroonCanadaCaribbeanCentral AmericaChileChinaColombiaCongoCosta RicaCroatiaCubaCzechoslovakiaDenmarkDominicaDominican RepublicEastern AfricaEastern AsiaEastern EuropeEcuadorEgyptEl SalvadorEnglandEritreaEthiopiaEuropeFijiFranceGermanyGhanaGreeceGrenadaGuatemalaGuyanaHaitiHondurasHong KongHungaryIndiaIndonesiaIranIraqIrelandIsraelItalyJamaicaJapanJordanKazakhstanKenyaKoreaKuwaitLaosLatin AmericaLatviaLebanonLiberiaLithuaniaMalaysiaMexicoMicronesiaMiddle AfricaMoldovaMoroccoNepalNetherlandsNicaraguaNigeriaNorth AmericaNorth MacedoniaNorthern AfricaNorthern EuropeNorwayOceaniaPakistanPanamaPeruPhilippinesPolandPortugalRomaniaRussiaSaudi ArabiaScotlandSenegalSerbiaSierra LeoneSingaporeSomaliaSouth AfricaSouth AmericaSouth Central AsiaSouth Eastern AsiaSouthern EuropeSpainSri LankaSt. Vincent and the GrenadinesSudanSwedenSwitzerlandSyriaTaiwanThailandTrinidad and TobagoTurkeyUgandaUkraineUruguayUzbekistanVenezuelaVietnamWest IndiesWestern AfricaWestern AsiaWestern EuropeYemenZaireZimbabweAzores
Professional Degree
Income
Poverty
Unemployment
Labor Participation
Family Structure
Vehicle Availability
Education Level
Disability

Professional Degree Comparison

Arapaho

Immigrants from Thailand

Tragic
Fair
2.9%
PROFESSIONAL DEGREE
0.0/ 100
METRIC RATING
337th/ 347
METRIC RANK
4.3%
PROFESSIONAL DEGREE
31.7/ 100
METRIC RATING
188th/ 347
METRIC RANK

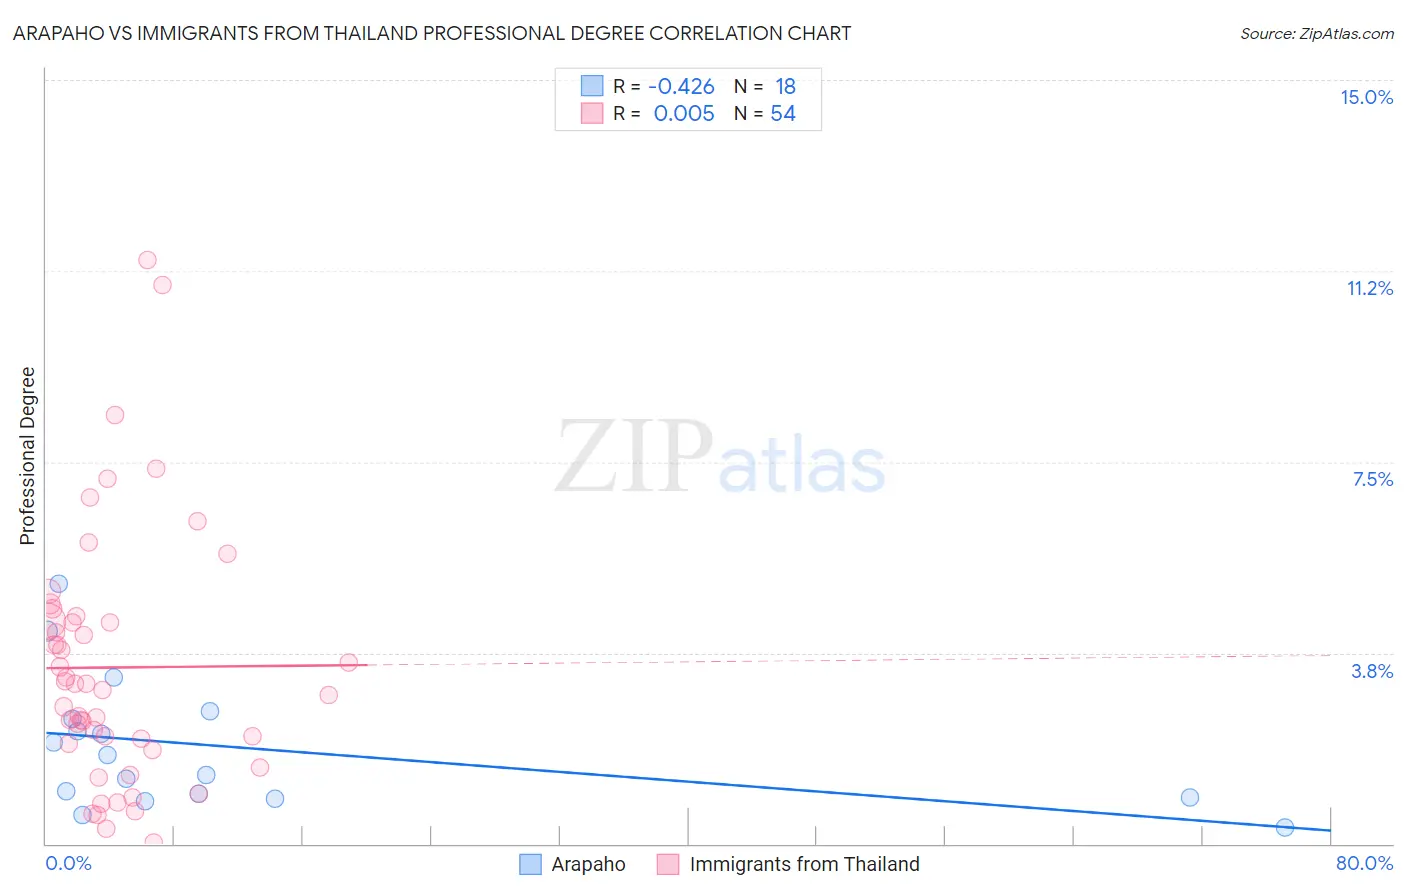
Arapaho vs Immigrants from Thailand Professional Degree Correlation Chart

The statistical analysis conducted on geographies consisting of 29,727,239 people shows a moderate negative correlation between the proportion of Arapaho and percentage of population with at least professional degree education in the United States with a correlation coefficient (R) of -0.426 and weighted average of 2.9%. Similarly, the statistical analysis conducted on geographies consisting of 316,529,517 people shows no correlation between the proportion of Immigrants from Thailand and percentage of population with at least professional degree education in the United States with a correlation coefficient (R) of 0.005 and weighted average of 4.3%, a difference of 49.0%.
Arapaho vs Immigrants from Thailand Professional Degree

Professional Degree Correlation Summary

MeasurementArapahoImmigrants from Thailand
Minimum0.33%0.034%
Maximum5.1%11.5%
Range4.8%11.4%
Mean1.9%3.5%
Median1.5%3.1%
Interquartile 25% (IQ1)0.91%2.0%
Interquartile 75% (IQ3)2.4%4.4%
Interquartile Range (IQR)1.5%2.4%
Standard Deviation (Sample)1.3%2.5%
Standard Deviation (Population)1.3%2.4%

Similar Demographics by Professional Degree

Demographics Similar to Arapaho by Professional Degree

In terms of professional degree, the demographic groups most similar to Arapaho are Navajo (2.9%, a difference of 0.070%), Immigrants from Central America (2.9%, a difference of 0.19%), Yup'ik (2.9%, a difference of 0.24%), Tohono O'odham (2.8%, a difference of 1.0%), and Immigrants from the Azores (2.8%, a difference of 1.7%).
DemographicsRating | RankProfessional Degree
Immigrants | Cabo Verde
0.0
/100
|
#330
Tragic
3.1%
Kiowa
0.0
/100
|
#331
Tragic
3.1%
Yakama
0.0
/100
|
#332
Tragic
3.1%
Puget Sound Salish
0.0
/100
|
#333
Tragic
3.1%
Pennsylvania Germans
0.0
/100
|
#334
Tragic
3.0%
Natives/Alaskans
0.0
/100
|
#335
Tragic
3.0%
Fijians
0.0
/100
|
#336
Tragic
2.9%
Arapaho
0.0
/100
|
#337
Tragic
2.9%
Navajo
0.0
/100
|
#338
Tragic
2.9%
Immigrants | Central America
0.0
/100
|
#339
Tragic
2.9%
Yup'ik
0.0
/100
|
#340
Tragic
2.9%
Tohono O'odham
0.0
/100
|
#341
Tragic
2.8%
Immigrants | Azores
0.0
/100
|
#342
Tragic
2.8%
Mexicans
0.0
/100
|
#343
Tragic
2.7%
Spanish American Indians
0.0
/100
|
#344
Tragic
2.7%

Demographics Similar to Immigrants from Thailand by Professional Degree

In terms of professional degree, the demographic groups most similar to Immigrants from Thailand are Slovak (4.3%, a difference of 0.17%), Immigrants from Cameroon (4.3%, a difference of 0.28%), Scotch-Irish (4.3%, a difference of 0.43%), Immigrants from Poland (4.3%, a difference of 0.44%), and Sri Lankan (4.3%, a difference of 0.47%).
DemographicsRating | RankProfessional Degree
Danes
43.5
/100
|
#181
Average
4.4%
Immigrants | Immigrants
43.2
/100
|
#182
Average
4.4%
Bermudans
43.1
/100
|
#183
Average
4.4%
Belgians
36.2
/100
|
#184
Fair
4.3%
Welsh
35.8
/100
|
#185
Fair
4.3%
Scotch-Irish
34.2
/100
|
#186
Fair
4.3%
Immigrants | Cameroon
33.3
/100
|
#187
Fair
4.3%
Immigrants | Thailand
31.7
/100
|
#188
Fair
4.3%
Slovaks
30.7
/100
|
#189
Fair
4.3%
Immigrants | Poland
29.2
/100
|
#190
Fair
4.3%
Sri Lankans
29.0
/100
|
#191
Fair
4.3%
Ghanaians
27.3
/100
|
#192
Fair
4.3%
French
27.1
/100
|
#193
Fair
4.2%
Scandinavians
25.8
/100
|
#194
Fair
4.2%
Nigerians
24.6
/100
|
#195
Fair
4.2%