Arab vs Maltese Associate's Degree
COMPARE
Arab
Maltese
Associate's Degree
Associate's Degree Comparison
Arabs
Maltese
49.0%
ASSOCIATE'S DEGREE
95.3/ 100
METRIC RATING
114th/ 347
METRIC RANK
50.4%
ASSOCIATE'S DEGREE
99.1/ 100
METRIC RATING
81st/ 347
METRIC RANK
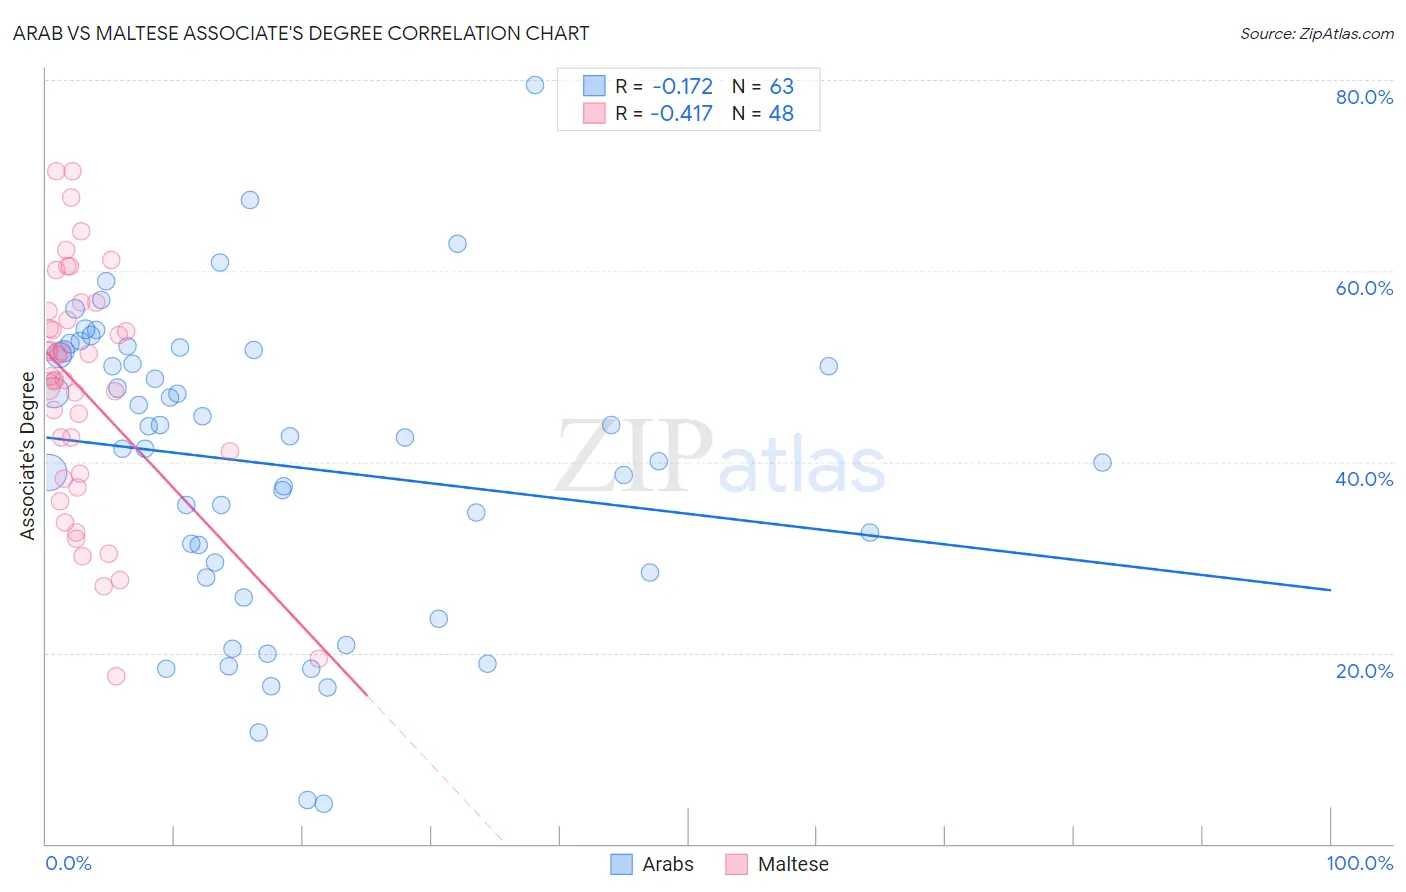
Arab vs Maltese Associate's Degree Correlation Chart
The statistical analysis conducted on geographies consisting of 486,836,450 people shows a poor negative correlation between the proportion of Arabs and percentage of population with at least associate's degree education in the United States with a correlation coefficient (R) of -0.172 and weighted average of 49.0%. Similarly, the statistical analysis conducted on geographies consisting of 126,471,941 people shows a moderate negative correlation between the proportion of Maltese and percentage of population with at least associate's degree education in the United States with a correlation coefficient (R) of -0.417 and weighted average of 50.4%, a difference of 2.9%.
Associate's Degree Correlation Summary
| Measurement | Arab | Maltese |
| Minimum | 4.3% | 17.6% |
| Maximum | 79.5% | 70.5% |
| Range | 75.3% | 52.9% |
| Mean | 39.7% | 47.5% |
| Median | 42.6% | 48.7% |
| Interquartile 25% (IQ1) | 28.4% | 38.5% |
| Interquartile 75% (IQ3) | 51.6% | 55.3% |
| Interquartile Range (IQR) | 23.3% | 16.8% |
| Standard Deviation (Sample) | 15.6% | 12.6% |
| Standard Deviation (Population) | 15.5% | 12.5% |
Similar Demographics by Associate's Degree
Demographics Similar to Arabs by Associate's Degree
In terms of associate's degree, the demographic groups most similar to Arabs are Immigrants from Chile (49.0%, a difference of 0.0%), Palestinian (49.0%, a difference of 0.0%), Luxembourger (48.9%, a difference of 0.070%), British (48.9%, a difference of 0.13%), and Afghan (48.9%, a difference of 0.18%).
| Demographics | Rating | Rank | Associate's Degree |
| Syrians | 96.7 /100 | #107 | Exceptional 49.3% |
| Jordanians | 96.6 /100 | #108 | Exceptional 49.2% |
| Immigrants | Morocco | 96.3 /100 | #109 | Exceptional 49.2% |
| Austrians | 95.8 /100 | #110 | Exceptional 49.1% |
| Immigrants | Venezuela | 95.8 /100 | #111 | Exceptional 49.1% |
| Immigrants | Chile | 95.3 /100 | #112 | Exceptional 49.0% |
| Palestinians | 95.3 /100 | #113 | Exceptional 49.0% |
| Arabs | 95.3 /100 | #114 | Exceptional 49.0% |
| Luxembourgers | 95.1 /100 | #115 | Exceptional 48.9% |
| British | 95.0 /100 | #116 | Exceptional 48.9% |
| Afghans | 94.8 /100 | #117 | Exceptional 48.9% |
| Albanians | 94.7 /100 | #118 | Exceptional 48.8% |
| Lebanese | 94.6 /100 | #119 | Exceptional 48.8% |
| Alsatians | 94.6 /100 | #120 | Exceptional 48.8% |
| Ugandans | 93.9 /100 | #121 | Exceptional 48.7% |
Demographics Similar to Maltese by Associate's Degree
In terms of associate's degree, the demographic groups most similar to Maltese are Armenian (50.4%, a difference of 0.070%), Ethiopian (50.4%, a difference of 0.10%), Immigrants from Eastern Europe (50.5%, a difference of 0.12%), Immigrants from Lebanon (50.5%, a difference of 0.16%), and Immigrants from Zimbabwe (50.5%, a difference of 0.19%).
| Demographics | Rating | Rank | Associate's Degree |
| Lithuanians | 99.3 /100 | #74 | Exceptional 50.6% |
| Immigrants | Scotland | 99.3 /100 | #75 | Exceptional 50.6% |
| Immigrants | Zimbabwe | 99.2 /100 | #76 | Exceptional 50.5% |
| Immigrants | Lebanon | 99.1 /100 | #77 | Exceptional 50.5% |
| Immigrants | Eastern Europe | 99.1 /100 | #78 | Exceptional 50.5% |
| Ethiopians | 99.1 /100 | #79 | Exceptional 50.4% |
| Armenians | 99.1 /100 | #80 | Exceptional 50.4% |
| Maltese | 99.1 /100 | #81 | Exceptional 50.4% |
| Greeks | 98.9 /100 | #82 | Exceptional 50.3% |
| Immigrants | Uzbekistan | 98.9 /100 | #83 | Exceptional 50.3% |
| Immigrants | Hungary | 98.9 /100 | #84 | Exceptional 50.2% |
| Immigrants | Egypt | 98.9 /100 | #85 | Exceptional 50.2% |
| Immigrants | Croatia | 98.9 /100 | #86 | Exceptional 50.2% |
| Immigrants | Moldova | 98.8 /100 | #87 | Exceptional 50.2% |
| Immigrants | Canada | 98.7 /100 | #88 | Exceptional 50.1% |