Arab vs Korean Disability Age 65 to 74
COMPARE
Arab
Korean
Disability Age 65 to 74
Disability Age 65 to 74 Comparison
Arabs
Koreans
22.8%
DISABILITY AGE 65 TO 74
84.8/ 100
METRIC RATING
143rd/ 347
METRIC RANK
23.1%
DISABILITY AGE 65 TO 74
64.2/ 100
METRIC RATING
160th/ 347
METRIC RANK
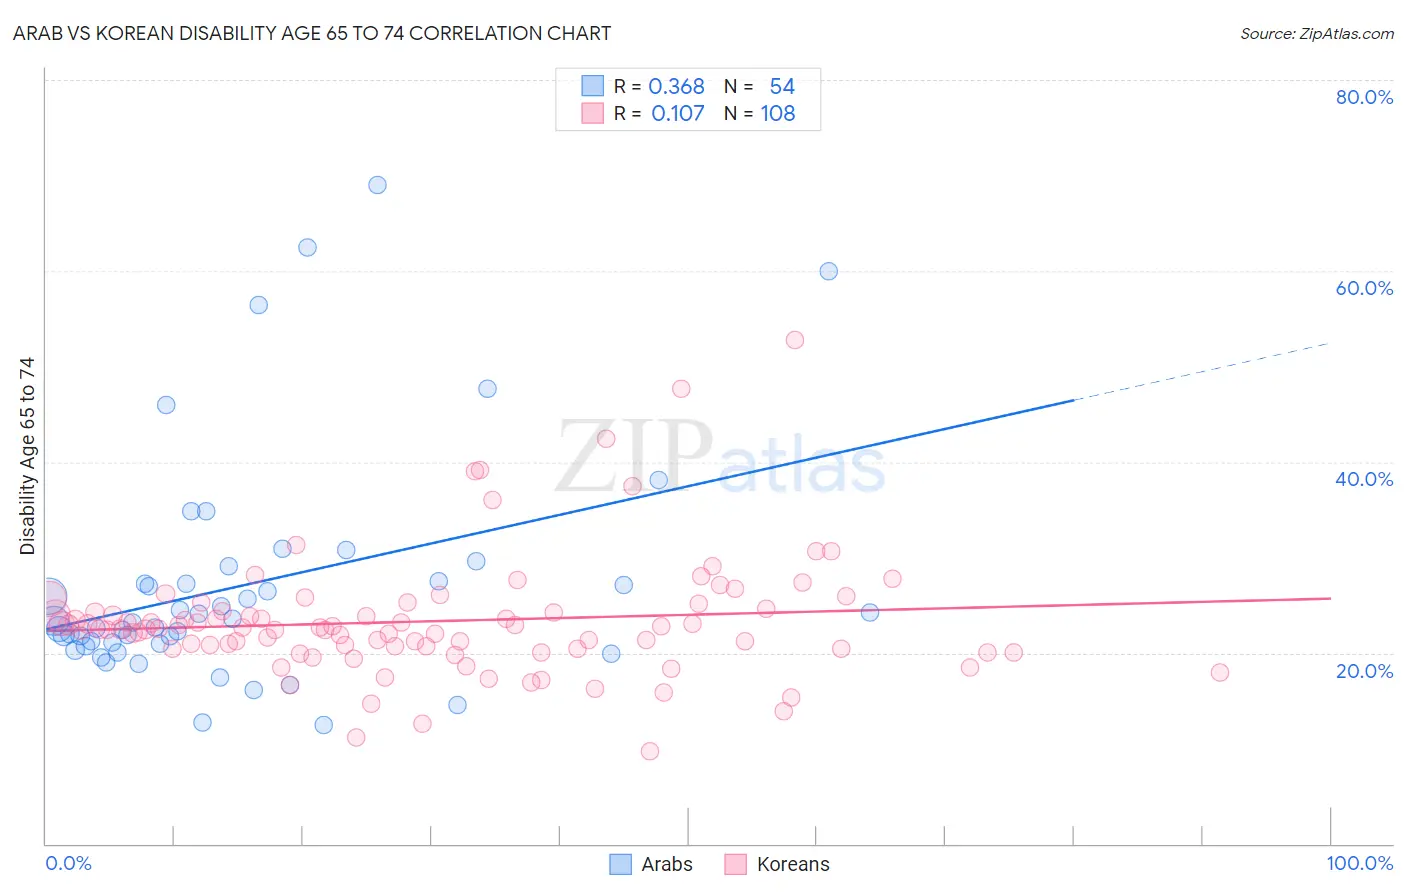
Arab vs Korean Disability Age 65 to 74 Correlation Chart
The statistical analysis conducted on geographies consisting of 485,549,986 people shows a mild positive correlation between the proportion of Arabs and percentage of population with a disability between the ages 65 and 75 in the United States with a correlation coefficient (R) of 0.368 and weighted average of 22.8%. Similarly, the statistical analysis conducted on geographies consisting of 509,278,408 people shows a poor positive correlation between the proportion of Koreans and percentage of population with a disability between the ages 65 and 75 in the United States with a correlation coefficient (R) of 0.107 and weighted average of 23.1%, a difference of 1.7%.
Disability Age 65 to 74 Correlation Summary
| Measurement | Arab | Korean |
| Minimum | 12.5% | 9.7% |
| Maximum | 69.0% | 52.7% |
| Range | 56.5% | 43.0% |
| Mean | 27.1% | 23.3% |
| Median | 23.3% | 22.5% |
| Interquartile 25% (IQ1) | 21.0% | 20.4% |
| Interquartile 75% (IQ3) | 27.5% | 24.5% |
| Interquartile Range (IQR) | 6.5% | 4.1% |
| Standard Deviation (Sample) | 12.1% | 6.4% |
| Standard Deviation (Population) | 12.0% | 6.4% |
Demographics Similar to Arabs and Koreans by Disability Age 65 to 74
In terms of disability age 65 to 74, the demographic groups most similar to Arabs are Danish (22.8%, a difference of 0.040%), Immigrants from Ethiopia (22.7%, a difference of 0.060%), Belgian (22.7%, a difference of 0.070%), Immigrants from Uganda (22.8%, a difference of 0.080%), and Alsatian (22.8%, a difference of 0.12%). Similarly, the demographic groups most similar to Koreans are Immigrants from Cameroon (23.1%, a difference of 0.030%), South American Indian (23.1%, a difference of 0.090%), Immigrants from Vietnam (23.1%, a difference of 0.33%), Czechoslovakian (23.0%, a difference of 0.56%), and Immigrants from Western Asia (23.0%, a difference of 0.67%).
| Demographics | Rating | Rank | Disability Age 65 to 74 |
| Belgians | 85.3 /100 | #141 | Excellent 22.7% |
| Immigrants | Ethiopia | 85.3 /100 | #142 | Excellent 22.7% |
| Arabs | 84.8 /100 | #143 | Excellent 22.8% |
| Danes | 84.4 /100 | #144 | Excellent 22.8% |
| Immigrants | Uganda | 84.0 /100 | #145 | Excellent 22.8% |
| Alsatians | 83.7 /100 | #146 | Excellent 22.8% |
| Immigrants | Uzbekistan | 83.1 /100 | #147 | Excellent 22.8% |
| New Zealanders | 79.9 /100 | #148 | Good 22.9% |
| Swiss | 79.7 /100 | #149 | Good 22.9% |
| Canadians | 77.7 /100 | #150 | Good 22.9% |
| Immigrants | Morocco | 77.6 /100 | #151 | Good 22.9% |
| Finns | 76.5 /100 | #152 | Good 22.9% |
| Slavs | 75.2 /100 | #153 | Good 23.0% |
| Sri Lankans | 74.0 /100 | #154 | Good 23.0% |
| British | 73.9 /100 | #155 | Good 23.0% |
| Immigrants | Western Asia | 73.8 /100 | #156 | Good 23.0% |
| Czechoslovakians | 72.4 /100 | #157 | Good 23.0% |
| Immigrants | Vietnam | 69.1 /100 | #158 | Good 23.1% |
| South American Indians | 65.5 /100 | #159 | Good 23.1% |
| Koreans | 64.2 /100 | #160 | Good 23.1% |
| Immigrants | Cameroon | 63.8 /100 | #161 | Good 23.1% |