Nonimmigrants vs Immigrants from Belarus Doctorate Degree
COMPARE
Nonimmigrants
Immigrants from Belarus
Doctorate Degree
Doctorate Degree Comparison
Nonimmigrants
Immigrants from Belarus
1.7%
DOCTORATE DEGREE
8.8/ 100
METRIC RATING
221st/ 347
METRIC RANK
2.2%
DOCTORATE DEGREE
99.7/ 100
METRIC RATING
78th/ 347
METRIC RANK
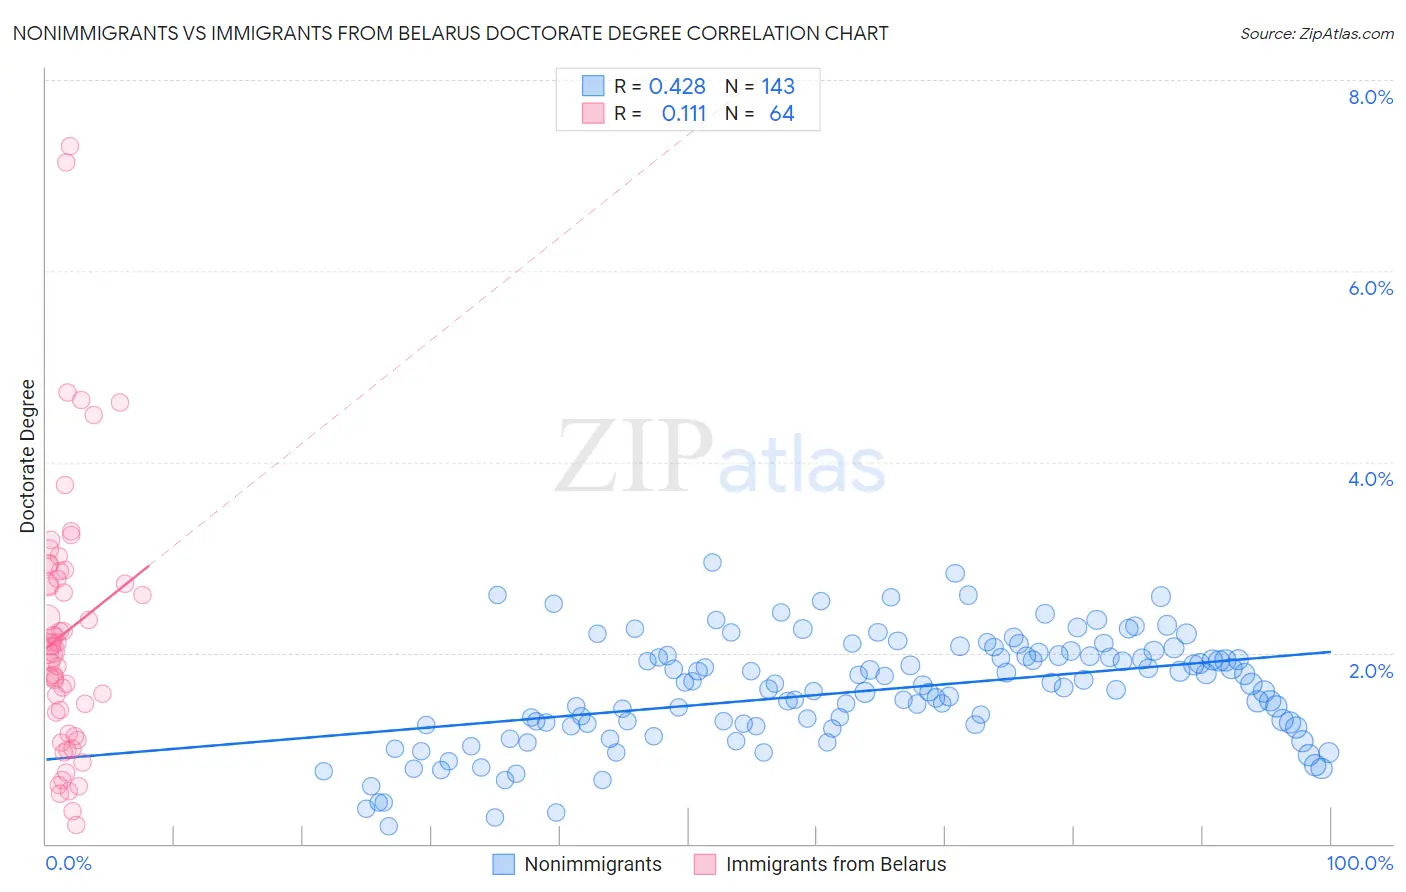
Nonimmigrants vs Immigrants from Belarus Doctorate Degree Correlation Chart
The statistical analysis conducted on geographies consisting of 553,265,434 people shows a moderate positive correlation between the proportion of Nonimmigrants and percentage of population with at least doctorate degree education in the United States with a correlation coefficient (R) of 0.428 and weighted average of 1.7%. Similarly, the statistical analysis conducted on geographies consisting of 150,000,226 people shows a poor positive correlation between the proportion of Immigrants from Belarus and percentage of population with at least doctorate degree education in the United States with a correlation coefficient (R) of 0.111 and weighted average of 2.2%, a difference of 32.9%.
Doctorate Degree Correlation Summary
| Measurement | Nonimmigrants | Immigrants from Belarus |
| Minimum | 0.18% | 0.19% |
| Maximum | 2.9% | 7.3% |
| Range | 2.8% | 7.1% |
| Mean | 1.6% | 2.2% |
| Median | 1.7% | 2.0% |
| Interquartile 25% (IQ1) | 1.2% | 1.3% |
| Interquartile 75% (IQ3) | 2.0% | 2.8% |
| Interquartile Range (IQR) | 0.73% | 1.6% |
| Standard Deviation (Sample) | 0.57% | 1.4% |
| Standard Deviation (Population) | 0.56% | 1.4% |
Similar Demographics by Doctorate Degree
Demographics Similar to Nonimmigrants by Doctorate Degree
In terms of doctorate degree, the demographic groups most similar to Nonimmigrants are Immigrants from Venezuela (1.7%, a difference of 0.070%), Immigrants from Uruguay (1.7%, a difference of 0.19%), Immigrants from Bosnia and Herzegovina (1.7%, a difference of 0.53%), Immigrants from Poland (1.7%, a difference of 0.75%), and Immigrants from Iraq (1.7%, a difference of 0.85%).
| Demographics | Rating | Rank | Doctorate Degree |
| Pueblo | 14.2 /100 | #214 | Poor 1.7% |
| Alaskan Athabascans | 13.8 /100 | #215 | Poor 1.7% |
| Immigrants | Burma/Myanmar | 13.5 /100 | #216 | Poor 1.7% |
| Spanish Americans | 12.9 /100 | #217 | Poor 1.7% |
| Tlingit-Haida | 11.9 /100 | #218 | Poor 1.7% |
| Immigrants | Iraq | 10.7 /100 | #219 | Poor 1.7% |
| Immigrants | Uruguay | 9.2 /100 | #220 | Tragic 1.7% |
| Immigrants | Nonimmigrants | 8.8 /100 | #221 | Tragic 1.7% |
| Immigrants | Venezuela | 8.7 /100 | #222 | Tragic 1.7% |
| Immigrants | Bosnia and Herzegovina | 7.8 /100 | #223 | Tragic 1.7% |
| Immigrants | Poland | 7.4 /100 | #224 | Tragic 1.7% |
| Immigrants | Colombia | 6.7 /100 | #225 | Tragic 1.7% |
| Osage | 6.5 /100 | #226 | Tragic 1.7% |
| Panamanians | 6.3 /100 | #227 | Tragic 1.7% |
| Assyrians/Chaldeans/Syriacs | 5.9 /100 | #228 | Tragic 1.7% |
Demographics Similar to Immigrants from Belarus by Doctorate Degree
In terms of doctorate degree, the demographic groups most similar to Immigrants from Belarus are Northern European (2.2%, a difference of 0.070%), Ugandan (2.2%, a difference of 0.35%), Immigrants from Argentina (2.2%, a difference of 0.40%), Immigrants from Lebanon (2.2%, a difference of 0.52%), and Immigrants from Hungary (2.2%, a difference of 0.53%).
| Demographics | Rating | Rank | Doctorate Degree |
| Immigrants | Bolivia | 99.8 /100 | #71 | Exceptional 2.3% |
| Immigrants | Canada | 99.8 /100 | #72 | Exceptional 2.3% |
| Immigrants | Bulgaria | 99.8 /100 | #73 | Exceptional 2.3% |
| Immigrants | North America | 99.8 /100 | #74 | Exceptional 2.2% |
| Immigrants | Western Asia | 99.8 /100 | #75 | Exceptional 2.2% |
| Immigrants | Hungary | 99.8 /100 | #76 | Exceptional 2.2% |
| Immigrants | Lebanon | 99.8 /100 | #77 | Exceptional 2.2% |
| Immigrants | Belarus | 99.7 /100 | #78 | Exceptional 2.2% |
| Northern Europeans | 99.7 /100 | #79 | Exceptional 2.2% |
| Ugandans | 99.7 /100 | #80 | Exceptional 2.2% |
| Immigrants | Argentina | 99.7 /100 | #81 | Exceptional 2.2% |
| Immigrants | Uganda | 99.6 /100 | #82 | Exceptional 2.2% |
| Immigrants | Lithuania | 99.6 /100 | #83 | Exceptional 2.2% |
| Immigrants | England | 99.6 /100 | #84 | Exceptional 2.2% |
| Immigrants | Brazil | 99.6 /100 | #85 | Exceptional 2.2% |