Arab vs Immigrants from Western Africa Doctorate Degree
COMPARE
Arab
Immigrants from Western Africa
Doctorate Degree
Doctorate Degree Comparison
Arabs
Immigrants from Western Africa
2.1%
DOCTORATE DEGREE
97.8/ 100
METRIC RATING
105th/ 347
METRIC RANK
1.7%
DOCTORATE DEGREE
15.4/ 100
METRIC RATING
209th/ 347
METRIC RANK
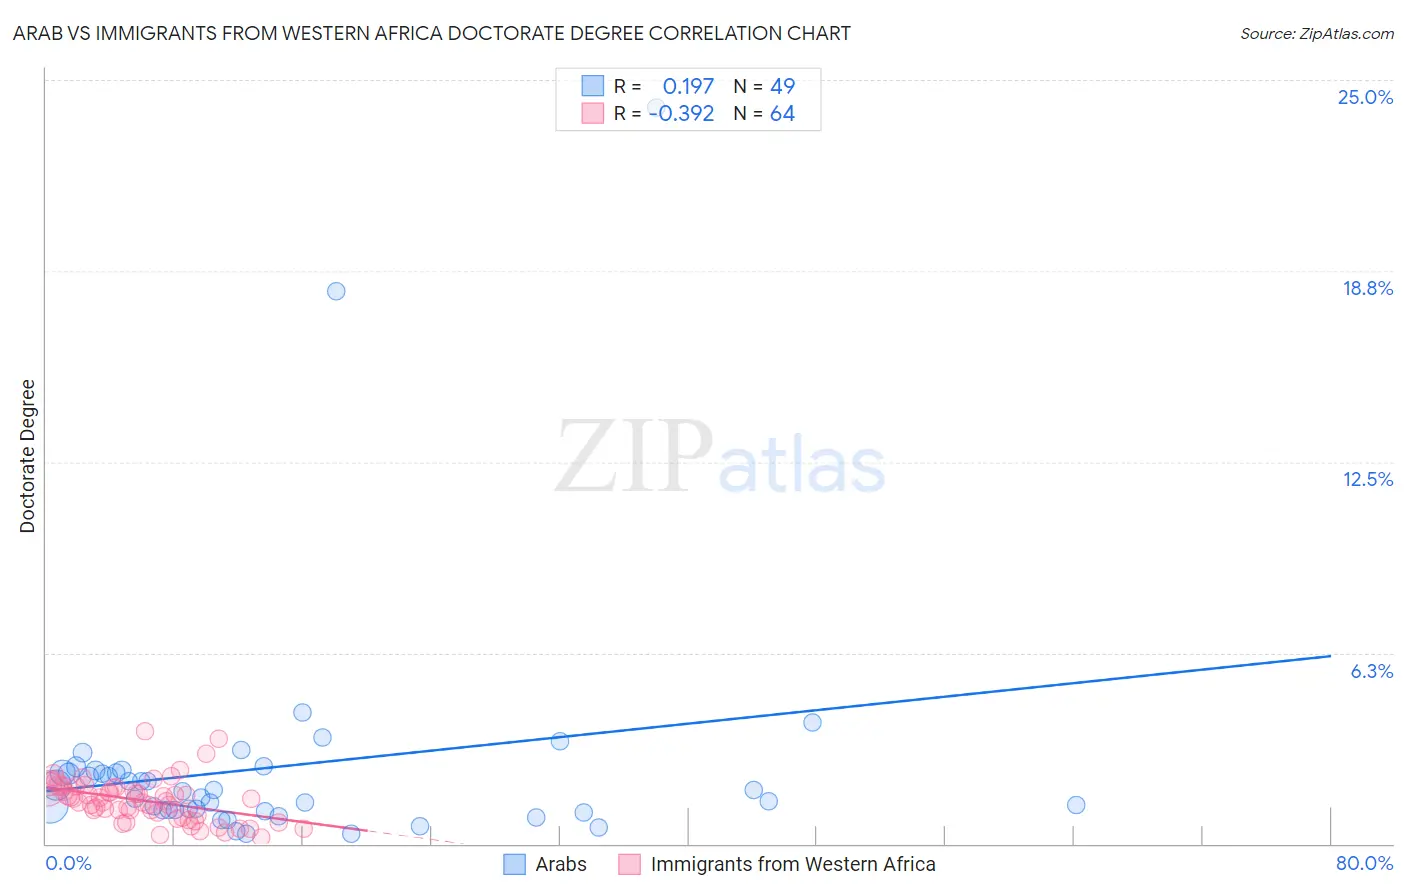
Arab vs Immigrants from Western Africa Doctorate Degree Correlation Chart
The statistical analysis conducted on geographies consisting of 479,921,881 people shows a poor positive correlation between the proportion of Arabs and percentage of population with at least doctorate degree education in the United States with a correlation coefficient (R) of 0.197 and weighted average of 2.1%. Similarly, the statistical analysis conducted on geographies consisting of 355,297,705 people shows a mild negative correlation between the proportion of Immigrants from Western Africa and percentage of population with at least doctorate degree education in the United States with a correlation coefficient (R) of -0.392 and weighted average of 1.7%, a difference of 21.5%.
Doctorate Degree Correlation Summary
| Measurement | Arab | Immigrants from Western Africa |
| Minimum | 0.33% | 0.21% |
| Maximum | 24.1% | 3.7% |
| Range | 23.8% | 3.5% |
| Mean | 2.5% | 1.4% |
| Median | 1.7% | 1.4% |
| Interquartile 25% (IQ1) | 1.1% | 0.90% |
| Interquartile 75% (IQ3) | 2.4% | 1.8% |
| Interquartile Range (IQR) | 1.3% | 0.92% |
| Standard Deviation (Sample) | 4.0% | 0.70% |
| Standard Deviation (Population) | 4.0% | 0.69% |
Similar Demographics by Doctorate Degree
Demographics Similar to Arabs by Doctorate Degree
In terms of doctorate degree, the demographic groups most similar to Arabs are Sudanese (2.1%, a difference of 0.10%), Austrian (2.1%, a difference of 0.35%), Romanian (2.1%, a difference of 0.47%), Immigrants from Chile (2.1%, a difference of 0.48%), and European (2.1%, a difference of 0.49%).
| Demographics | Rating | Rank | Doctorate Degree |
| Armenians | 98.3 /100 | #98 | Exceptional 2.1% |
| Immigrants | Egypt | 98.2 /100 | #99 | Exceptional 2.1% |
| Immigrants | Eastern Europe | 98.2 /100 | #100 | Exceptional 2.1% |
| Immigrants | Eastern Africa | 98.2 /100 | #101 | Exceptional 2.1% |
| Immigrants | Chile | 98.1 /100 | #102 | Exceptional 2.1% |
| Romanians | 98.1 /100 | #103 | Exceptional 2.1% |
| Austrians | 98.0 /100 | #104 | Exceptional 2.1% |
| Arabs | 97.8 /100 | #105 | Exceptional 2.1% |
| Sudanese | 97.7 /100 | #106 | Exceptional 2.1% |
| Europeans | 97.5 /100 | #107 | Exceptional 2.1% |
| Immigrants | Germany | 97.3 /100 | #108 | Exceptional 2.1% |
| Ukrainians | 97.2 /100 | #109 | Exceptional 2.1% |
| Brazilians | 97.2 /100 | #110 | Exceptional 2.1% |
| Immigrants | Pakistan | 97.1 /100 | #111 | Exceptional 2.1% |
| Syrians | 97.1 /100 | #112 | Exceptional 2.1% |
Demographics Similar to Immigrants from Western Africa by Doctorate Degree
In terms of doctorate degree, the demographic groups most similar to Immigrants from Western Africa are Tongan (1.7%, a difference of 0.080%), Immigrants from Armenia (1.7%, a difference of 0.10%), Colombian (1.7%, a difference of 0.19%), Immigrants from South Eastern Asia (1.7%, a difference of 0.22%), and Korean (1.7%, a difference of 0.37%).
| Demographics | Rating | Rank | Doctorate Degree |
| Portuguese | 21.4 /100 | #202 | Fair 1.8% |
| Immigrants | Vietnam | 21.4 /100 | #203 | Fair 1.8% |
| Somalis | 21.2 /100 | #204 | Fair 1.7% |
| Venezuelans | 19.5 /100 | #205 | Poor 1.7% |
| Immigrants | Peru | 17.6 /100 | #206 | Poor 1.7% |
| Yugoslavians | 17.1 /100 | #207 | Poor 1.7% |
| Colombians | 16.1 /100 | #208 | Poor 1.7% |
| Immigrants | Western Africa | 15.4 /100 | #209 | Poor 1.7% |
| Tongans | 15.1 /100 | #210 | Poor 1.7% |
| Immigrants | Armenia | 15.1 /100 | #211 | Poor 1.7% |
| Immigrants | South Eastern Asia | 14.7 /100 | #212 | Poor 1.7% |
| Koreans | 14.2 /100 | #213 | Poor 1.7% |
| Pueblo | 14.2 /100 | #214 | Poor 1.7% |
| Alaskan Athabascans | 13.8 /100 | #215 | Poor 1.7% |
| Immigrants | Burma/Myanmar | 13.5 /100 | #216 | Poor 1.7% |