Okinawan vs Argentinean No Schooling Completed
COMPARE
Okinawan
Argentinean
No Schooling Completed
No Schooling Completed Comparison
Okinawans
Argentineans
1.8%
NO SCHOOLING COMPLETED
97.1/ 100
METRIC RATING
108th/ 347
METRIC RANK
2.1%
NO SCHOOLING COMPLETED
56.0/ 100
METRIC RATING
170th/ 347
METRIC RANK
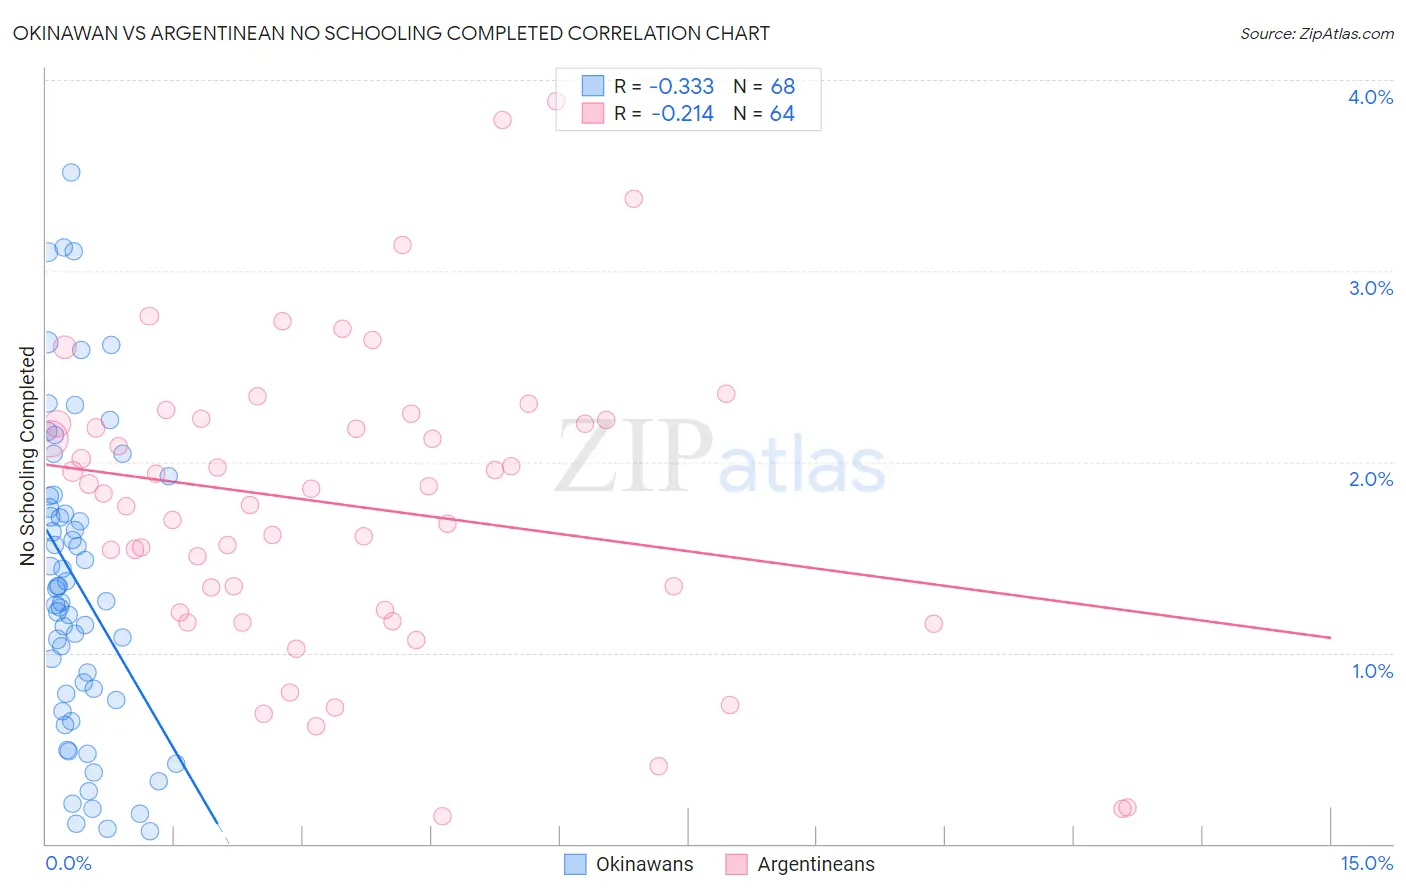
Okinawan vs Argentinean No Schooling Completed Correlation Chart
The statistical analysis conducted on geographies consisting of 73,597,304 people shows a mild negative correlation between the proportion of Okinawans and percentage of population with no schooling in the United States with a correlation coefficient (R) of -0.333 and weighted average of 1.8%. Similarly, the statistical analysis conducted on geographies consisting of 295,019,263 people shows a weak negative correlation between the proportion of Argentineans and percentage of population with no schooling in the United States with a correlation coefficient (R) of -0.214 and weighted average of 2.1%, a difference of 12.4%.
No Schooling Completed Correlation Summary
| Measurement | Okinawan | Argentinean |
| Minimum | 0.067% | 0.14% |
| Maximum | 3.5% | 3.9% |
| Range | 3.5% | 3.7% |
| Mean | 1.4% | 1.8% |
| Median | 1.3% | 1.8% |
| Interquartile 25% (IQ1) | 0.77% | 1.2% |
| Interquartile 75% (IQ3) | 1.8% | 2.2% |
| Interquartile Range (IQR) | 1.0% | 0.99% |
| Standard Deviation (Sample) | 0.81% | 0.79% |
| Standard Deviation (Population) | 0.80% | 0.79% |
Similar Demographics by No Schooling Completed
Demographics Similar to Okinawans by No Schooling Completed
In terms of no schooling completed, the demographic groups most similar to Okinawans are Yugoslavian (1.8%, a difference of 0.22%), Immigrants from France (1.8%, a difference of 0.26%), Immigrants from Saudi Arabia (1.9%, a difference of 0.35%), Immigrants from Latvia (1.9%, a difference of 0.48%), and Immigrants from Japan (1.9%, a difference of 0.63%).
| Demographics | Rating | Rank | No Schooling Completed |
| Immigrants | Czechoslovakia | 97.9 /100 | #101 | Exceptional 1.8% |
| Immigrants | Switzerland | 97.9 /100 | #102 | Exceptional 1.8% |
| Basques | 97.9 /100 | #103 | Exceptional 1.8% |
| Thais | 97.5 /100 | #104 | Exceptional 1.8% |
| German Russians | 97.5 /100 | #105 | Exceptional 1.8% |
| Immigrants | France | 97.3 /100 | #106 | Exceptional 1.8% |
| Yugoslavians | 97.2 /100 | #107 | Exceptional 1.8% |
| Okinawans | 97.1 /100 | #108 | Exceptional 1.8% |
| Immigrants | Saudi Arabia | 96.8 /100 | #109 | Exceptional 1.9% |
| Immigrants | Latvia | 96.7 /100 | #110 | Exceptional 1.9% |
| Immigrants | Japan | 96.6 /100 | #111 | Exceptional 1.9% |
| Pueblo | 96.4 /100 | #112 | Exceptional 1.9% |
| Immigrants | Zimbabwe | 96.2 /100 | #113 | Exceptional 1.9% |
| Immigrants | Norway | 96.1 /100 | #114 | Exceptional 1.9% |
| Syrians | 96.0 /100 | #115 | Exceptional 1.9% |
Demographics Similar to Argentineans by No Schooling Completed
In terms of no schooling completed, the demographic groups most similar to Argentineans are Apache (2.1%, a difference of 0.090%), Immigrants from Poland (2.1%, a difference of 0.11%), Cheyenne (2.1%, a difference of 0.36%), Egyptian (2.1%, a difference of 0.44%), and Immigrants from Argentina (2.1%, a difference of 0.45%).
| Demographics | Rating | Rank | No Schooling Completed |
| Albanians | 62.2 /100 | #163 | Good 2.1% |
| Comanche | 60.7 /100 | #164 | Good 2.1% |
| Brazilians | 60.2 /100 | #165 | Good 2.1% |
| Dutch West Indians | 59.9 /100 | #166 | Average 2.1% |
| Egyptians | 59.2 /100 | #167 | Average 2.1% |
| Cheyenne | 58.6 /100 | #168 | Average 2.1% |
| Apache | 56.7 /100 | #169 | Average 2.1% |
| Argentineans | 56.0 /100 | #170 | Average 2.1% |
| Immigrants | Poland | 55.2 /100 | #171 | Average 2.1% |
| Immigrants | Argentina | 52.7 /100 | #172 | Average 2.1% |
| Immigrants | Belarus | 51.8 /100 | #173 | Average 2.1% |
| Immigrants | Micronesia | 50.0 /100 | #174 | Average 2.1% |
| Arabs | 46.4 /100 | #175 | Average 2.1% |
| Panamanians | 45.2 /100 | #176 | Average 2.1% |
| Arapaho | 45.0 /100 | #177 | Average 2.1% |